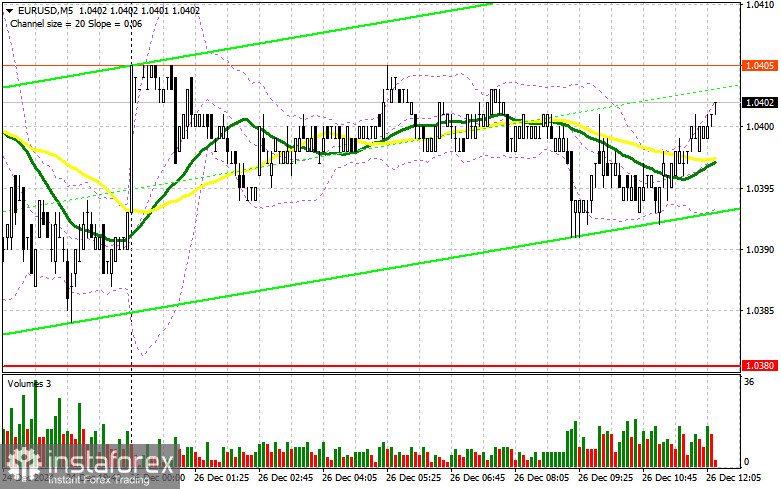
In my morning forecast, I highlighted the 1.0413 level as a key decision point for entering the market. Let's analyze the 5-minute chart to review the outcome. The pair rose but did not reach the 1.0413 level. As a result, I had no entry points in the first half of the day. The technical picture has not been revised for the second half of the day.

To Open Long Positions on EUR/USD:
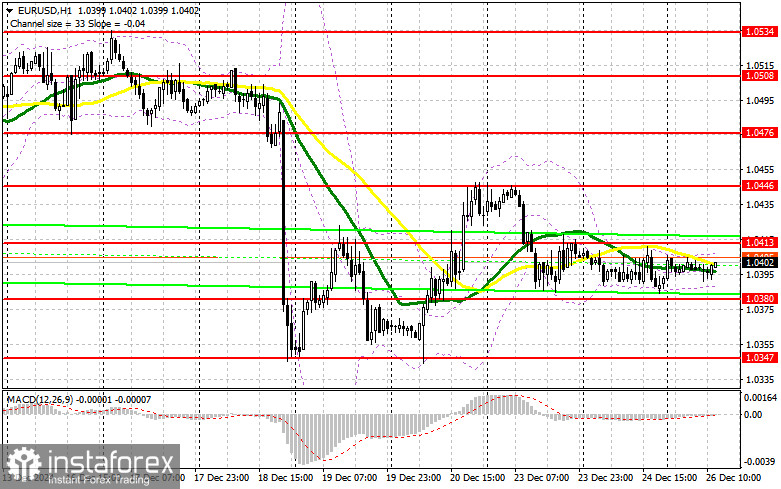
Low volatility and a lack of statistics have defined the European session, leaving me without any trades. Don't be surprised if the second half of the day follows the same pattern, as there are no significant releases expected from the U.S. The weekly jobless claims data from the U.S. is unlikely to generate much interest at year-end. Only a significant deviation from economists' forecasts could stir market movement. Otherwise, the pair is likely to remain within the current sideways range.
In case of a decline, only a false breakout near 1.0380, a support level formed last week, will provide a good entry point for long positions with the aim of returning to 1.0413. A breakout and retest of this range will confirm the right entry point for buying, targeting 1.0446. The most distant target will be the 1.0476 level, where I plan to take profits. If the pair falls and lacks activity around 1.0380 in the second half of the day (a likely scenario for reasons mentioned earlier), pressure on the euro will increase, potentially leading to a sharper drop. In such a case, I will only consider entering long positions after a false breakout near the weekly low at 1.0347. Long positions from a rebound are possible at 1.0308, aiming for a 30-35 point intraday upward correction.
To Open Short Positions on EUR/USD:
If the euro rises in the second half of the day, protecting the 1.0413 resistance, which we failed to reach earlier, will remain a priority for sellers. A false breakout at this level will return bearish momentum and create a good entry point for short positions targeting the 1.0380 support level. A breakout and retest below this range will provide another selling opportunity, with the pair moving toward the 1.0347 low, effectively undermining buyers' attempts to correct the pair further. The most distant target will be the 1.0308 level, where I plan to take profits.
If EUR/USD rises in the second half of the day and bears fail to act near 1.0413, where moving averages supporting sellers are located, I will postpone short positions until a test of the next resistance at 1.0446. I will sell there only after a failed breakout. Short positions on a rebound are planned from 1.0476, targeting a 30-35 point downward correction.

COT Report (Commitments of Traders):
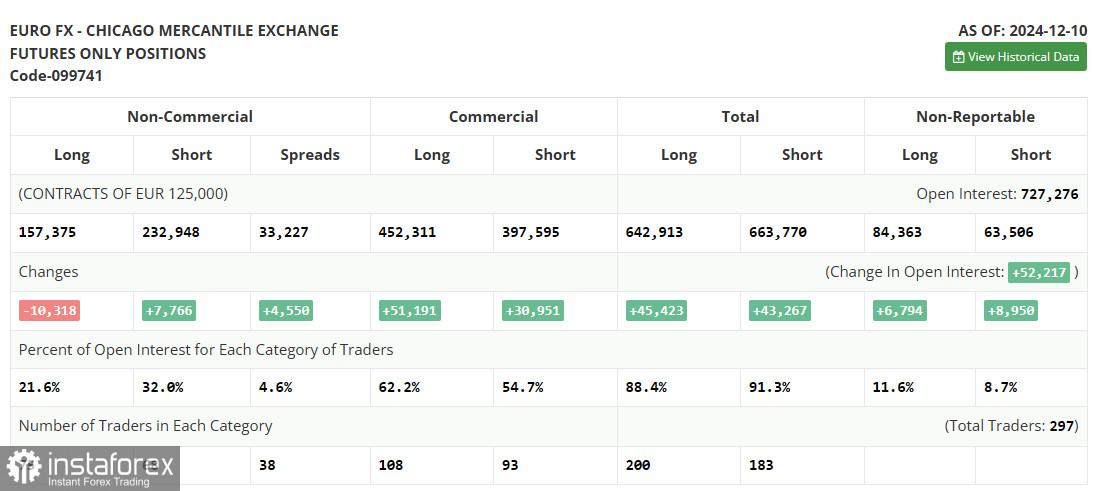
The December 10 report showed an increase in short positions and a reduction in long ones. Overall, the new figures maintained the market's balance of power. In the near term, the Federal Reserve's final meeting of the year is expected, where a rate cut decision is likely. This has prevented the dollar from strengthening while maintaining demand for riskier assets. Non-commercial long positions fell by 10,318 to 157,375, while short positions increased by 7,766 to 232,948. The net gap between long and short positions widened by 4,450.

Indicator Signals:
Moving Averages
Trading is happening around the 30 and 50-day moving averages, indicating a sideways market trend.
Note: The moving averages discussed are based on the H1 hourly chart and differ from the classic moving averages used on the daily D1 chart.
Bollinger Bands
In case of a decline, the lower boundary of the indicator near 1.0380 will act as support.
Indicator Description:
- Moving Average (MA): Defines the current trend by smoothing volatility and noise.
- Period – 50 (yellow line on the chart).
- Period – 30 (green line on the chart).
- MACD Indicator: Moving Average Convergence/Divergence with fast EMA – period 12, slow EMA – period 26, and SMA – period 9.
- Bollinger Bands: Period – 20.
- Non-commercial Traders: Speculators such as individual traders, hedge funds, and large institutions using the futures market for speculative purposes.
- Long Non-commercial Positions: Represent the total long open positions of non-commercial traders.
- Short Non-commercial Positions: Represent the total short open positions of non-commercial traders.
- Net Non-commercial Position: The difference between short and long positions of non-commercial traders.


