EUR/USD 5-Minute Analysis

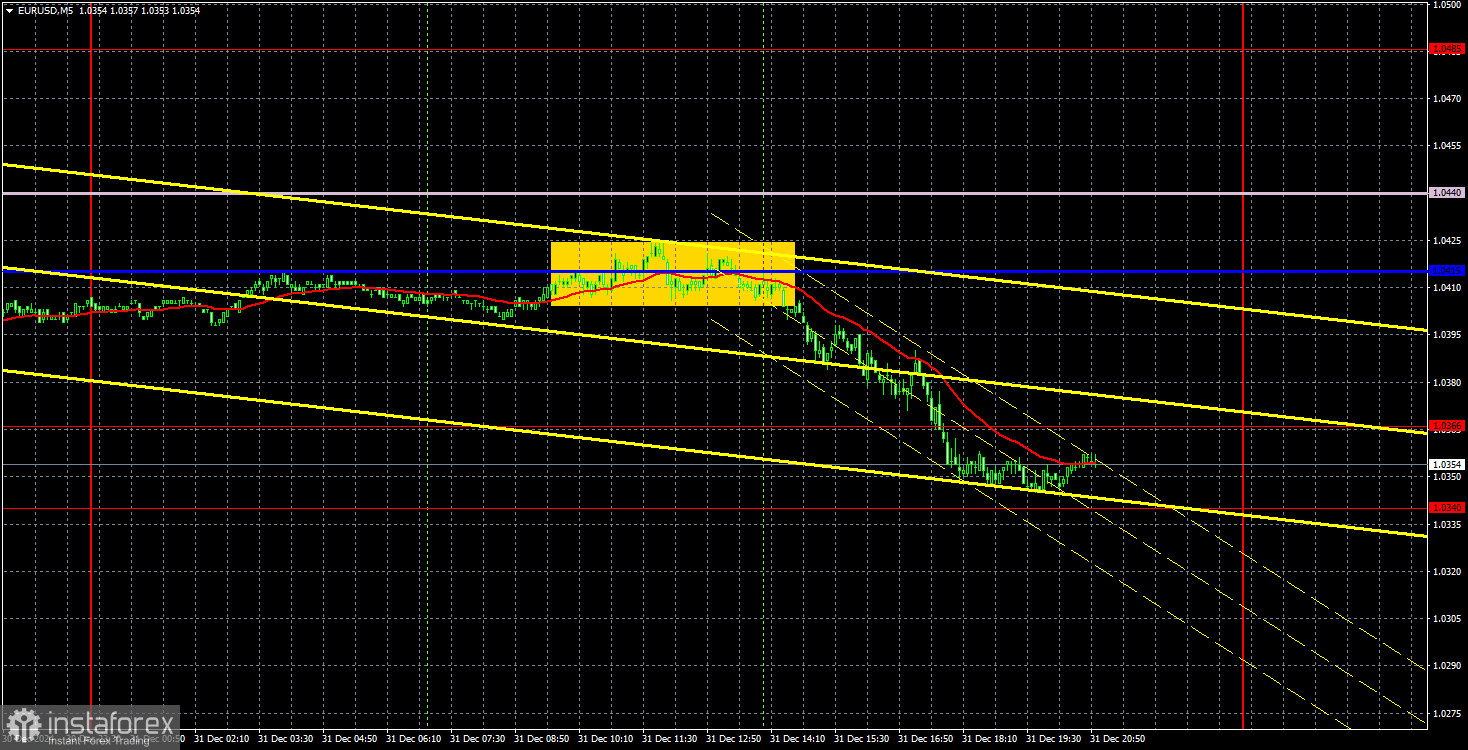
The EUR/USD currency pair experienced a decline on Monday and Tuesday. Although the euro lost approximately 100 pips over the last two trading days of the year, it remains within the sideways range of 1.0340 to 1.0450. In the past two days, the euro has simply fallen from the upper boundary of this range to the lower boundary. It is possible for it to rebound from the lower boundary and rise back to the upper boundary. However, in the medium term, the downtrend remains intact, and it is likely just a matter of time before the 1.0340 level is breached, potentially leading to further declines toward the 1.0000 target. The fact that market participants continued to sell the euro actively even ahead of New Year's speaks volumes.
No macroeconomic reports or significant fundamental events were published in either the Eurozone or the US over the last two trading days, so there is little to analyze.
On Tuesday, one tradable signal was generated. During the European session, the price hovered around a critical line. However, in the early US session, it rebounded from this level and began moving downward. By the end of the day, the price had reached the 1.0340–1.0366 range, where profits could have been locked in.
COT Report

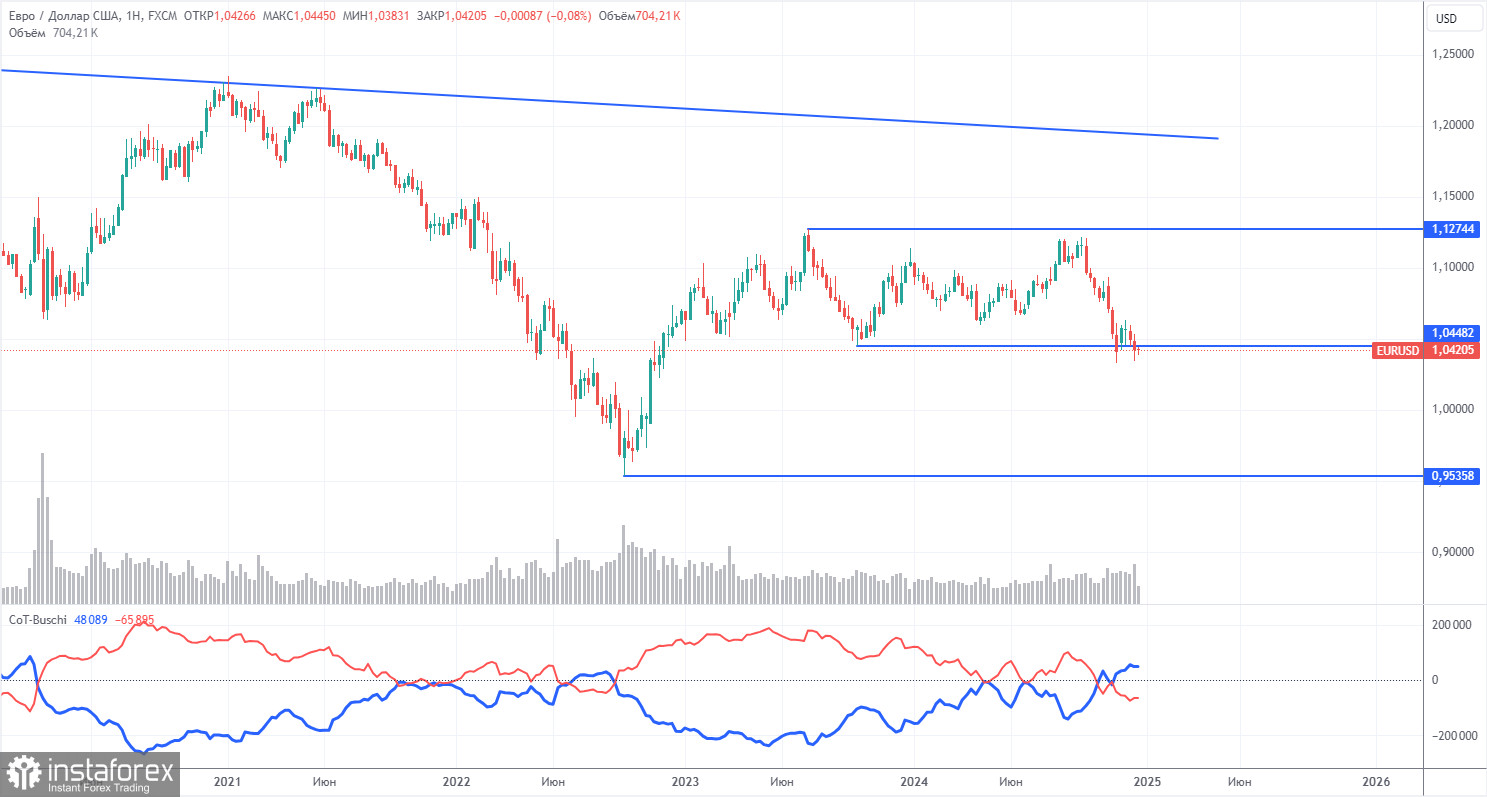
The most recent Commitment of Traders (COT) report is dated December 17. As shown in the chart above, the net position of non-commercial traders has been consistently bullish, but bears have finally gained the upper hand. Two months ago, there was a significant increase in the number of short positions opened by professional traders, causing the net position to turn negative for the first time in a long while. This indicates that the euro is now being sold more frequently than it is being bought.
Currently, no fundamental factors support the strengthening of the euro, and technical analysis suggests that the currency pair remains in a consolidation zone, which means it's experiencing a flat trend. In terms of the weekly timeframe, it is evident that the pair has been trading between 1.0448 and 1.1274 since December 2022. Consequently, further declines are more likely, and a break below the 1.0448 level could open up new downside opportunities for the euro.
Currently, the red and blue lines on the COT chart have crossed each other, indicating a bearish market trend. During the last reporting week, the number of long positions in the non-commercial group decreased by 4,700, while short positions dropped by 14,400. As a result, the net position increased by nearly 10,000, but this does not change the overall trend.
EUR/USD 1-Hour Analysis

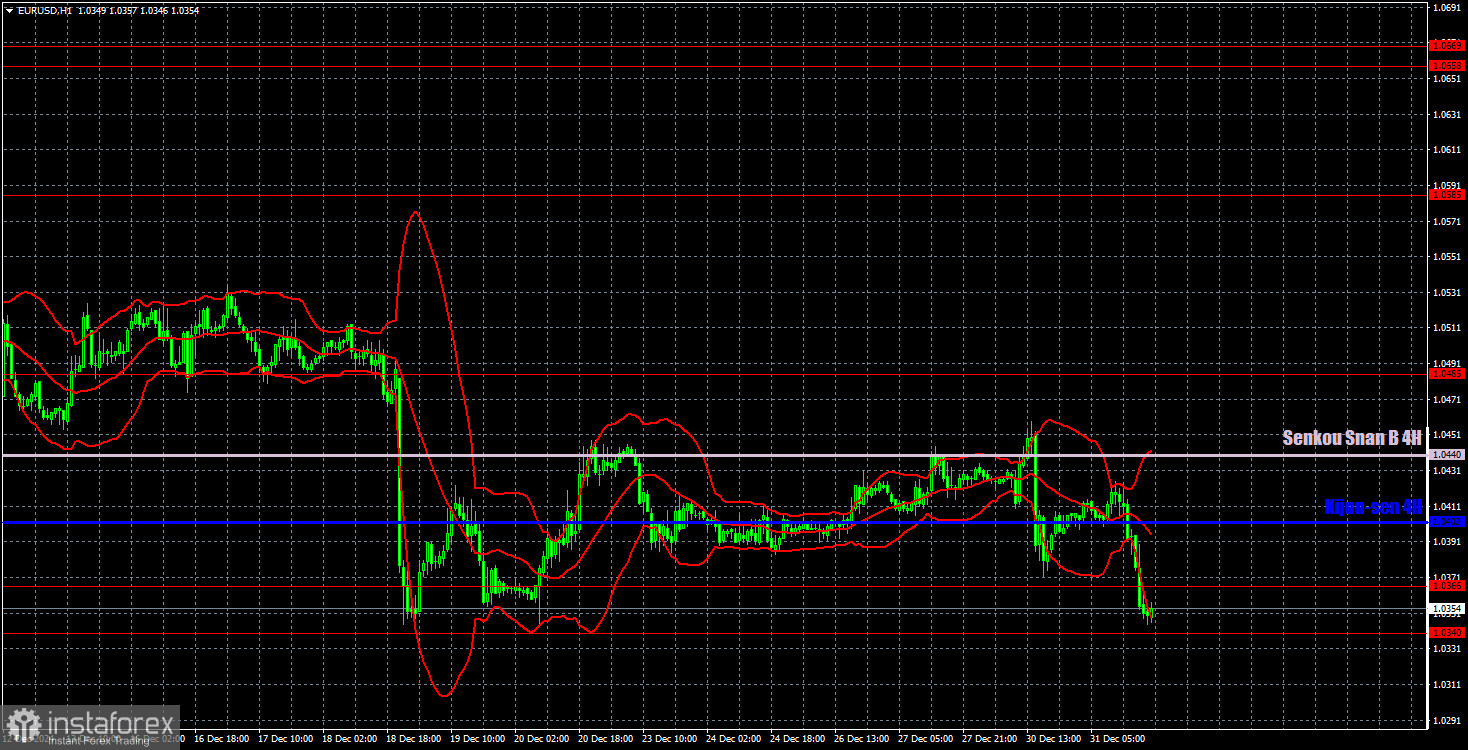
On the hourly timeframe, the currency pair continues to trade within a flat range. We anticipate that a medium-term decline will resume regardless of this range. The Federal Reserve is expected to reduce interest rates only 1–2 times in 2025, which is significantly more hawkish than the scenario currently priced in by the market. We still see no justification for a substantial rise in the euro. Additionally, the euro has struggled to move away from the 1.0340–1.0366 range. During the holiday period, a flat trend was observed, which is quite logical.
For January 2, we highlight the following trading levels: 1.0195, 1.0269, 1.0340-1.0366, 1.0485, 1.0585, 1.0658-1.0669, 1.0757, 1.0797, 1.0843, and 1.0889. We also note the Senkou Span B at 1.0440 and the Kijun-sen at 1.0402. Please keep in mind that these levels and lines may shift throughout the day, which should be considered when determining trading signals. Always set a Stop Loss order to breakeven once the price has moved 15 pips in your favor. This will help protect against potential losses in case the signal turns out to be false.
On Thursday, Germany and the Eurozone will release their final manufacturing Purchasing Managers' Index (PMI) estimates for December, but we consider these figures to be relatively unimportant. Similarly, in the United States, reports on jobless claims and the revised estimate of the December manufacturing PMI will be published, which we also regard as secondary information.
Illustration Explanations:
- Support and Resistance Levels (thick red lines): Thick red lines indicate where movement may come to an end. Please note that these lines are not sources of trading signals.
- Kijun-sen and Senkou Span B Lines: Ichimoku indicator lines transferred from the 4-hour timeframe to the hourly timeframe. These are strong lines.
- Extreme Levels (thin red lines): Thin red lines where the price has previously bounced. These serve as sources of trading signals.
- Yellow Lines: Trendlines, trend channels, or any other technical patterns.
- Indicator 1 on COT Charts: Represents the net position size for each category of traders.


