Analysis of Thursday's Trades
1H Chart of EUR/USD

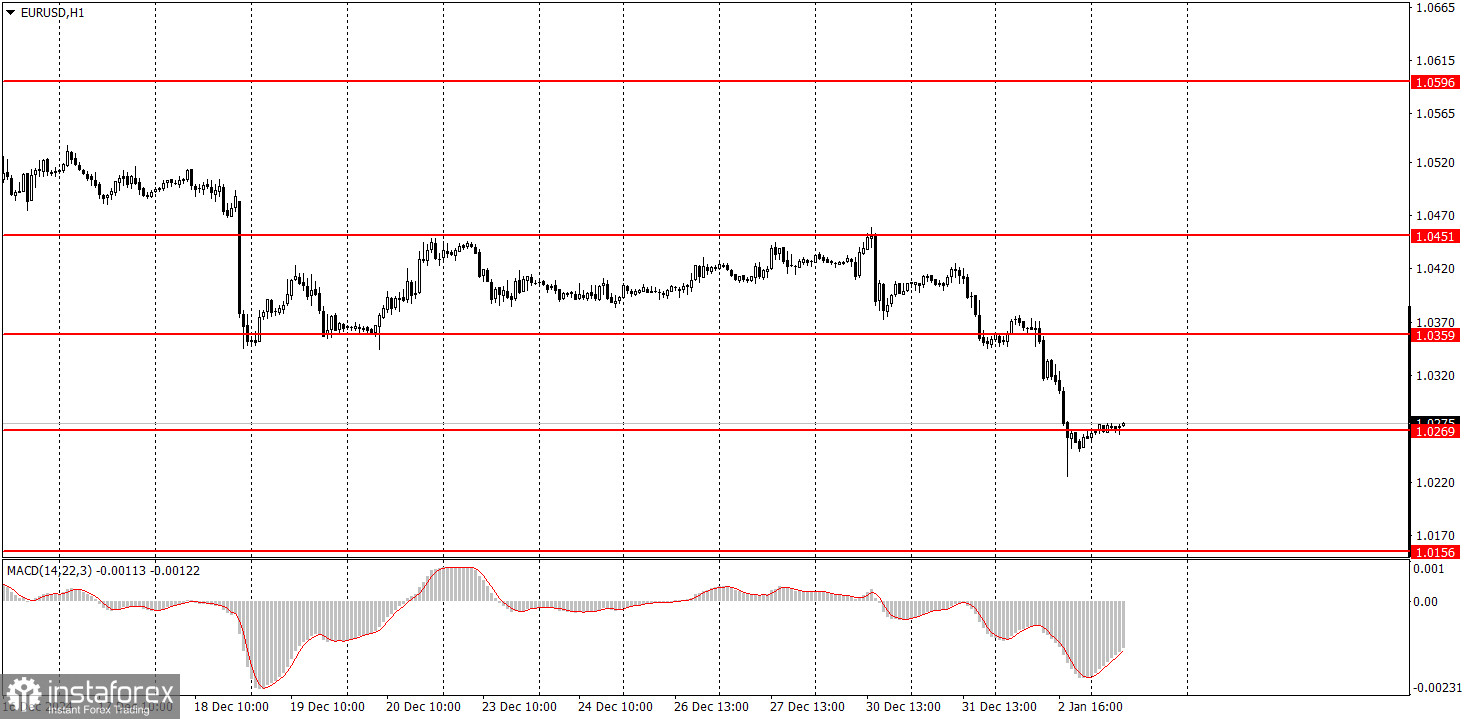
The EUR/USD currency pair experienced a sharp decline on Thursday, marking a significant drop on the first trading day of the new year. It's important to note that there were no local factors responsible for this plunge on January 2. However, the fundamental backdrop throughout 2024 had consistently indicated a potential significant decline in both the euro and the pound, a scenario we have highlighted multiple times.
As the new year begins, we see a familiar trend: the euro is falling while the dollar is rising, and this movement is entirely logical. On Thursday, the second estimates for manufacturing PMIs in Germany, the Eurozone, and the United States were released. However, these reports did not trigger the euro's sharp decline; their results were not particularly significant, and second estimates are generally less important than initial ones.
Instead, we observed the continuation of a trend that began in September 2024. During the holiday season, the market paused, and the currency pair remained in a horizontal channel for several weeks. Now, that downtrend has resumed.
5M Chart of EUR/USD

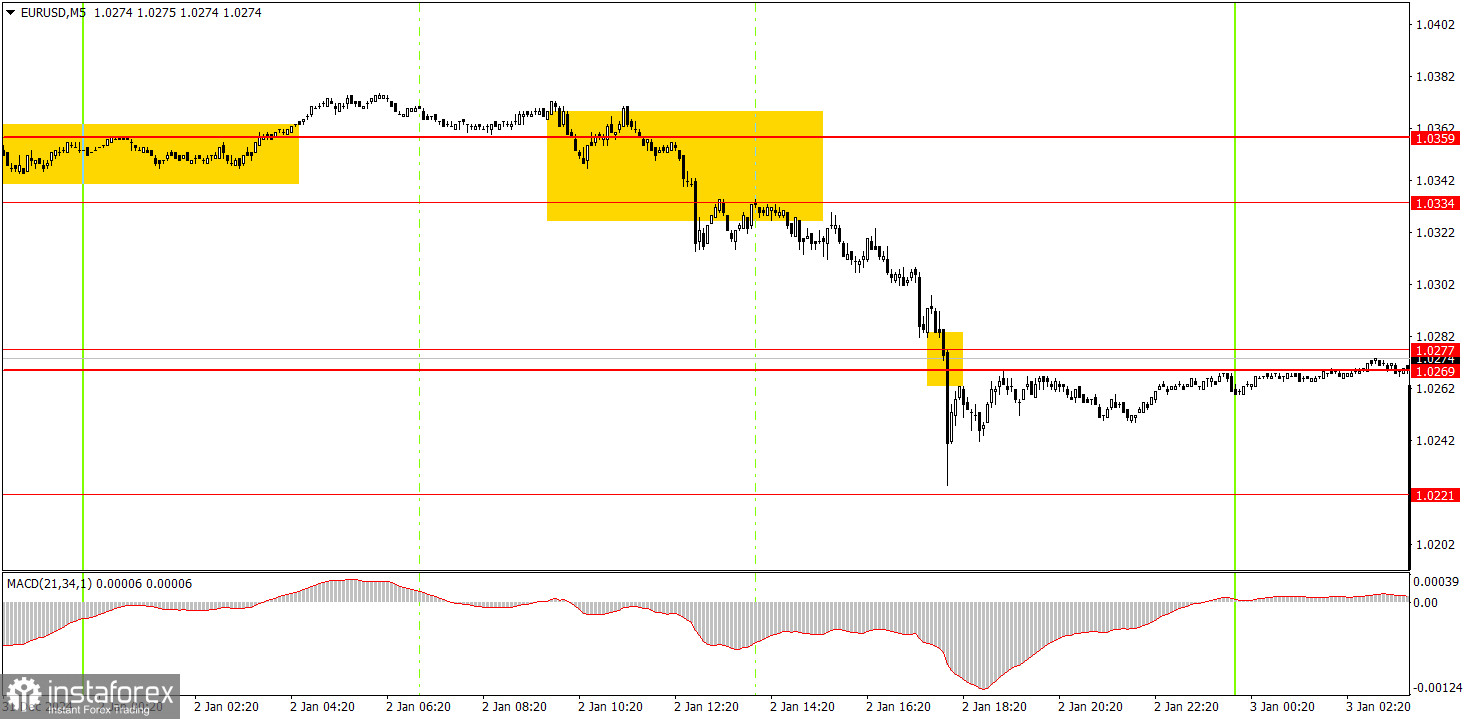
In the 5-minute time frame, a sell signal formed almost at the beginning of the movement on Thursday. The price broke below the significant range of 1.0334–1.0359 that we had previously identified. Following this, the euro easily moved through the 1.0269–1.0277 zone and nearly reached the 1.0223 level. Therefore, closing sell trades at any point below 1.0269 would have led to substantial profits from this trade.
Trading Strategy for Friday:
In the hourly time frame, the EUR/USD pair has exited the "holiday flat." We believe that the decline of the euro has resumed in the medium term, and the pair is now just one step away from parity. As before, the euro is expected to continue its downward trend, supported by both fundamental and macroeconomic factors that favor the US dollar.
On Friday, the pair may rebound from the 1.0269–1.0277 range and continue its downward movement. A breakout above this area would indicate a possible corrective phase.
On the 5-minute time frame, keep an eye on the following levels: 1.0269–1.0277, 1.0334–1.0359, 1.0433–1.0451, 1.0526, 1.0596, 1.0678, 1.0726–1.0733, 1.0797–1.0804, 1.0845–1.0851, and 1.0888–1.0896. On Friday, the first relatively significant report in weeks—the US ISM Manufacturing PMI—will be released. This report is genuinely important, and we have already observed extreme volatility in the market on the first trading day of the year, which aligns with the primary trend.
Core Trading System Rules:
- Signal Strength: The shorter the time it takes for a signal to form (a rebound or breakout), the stronger the signal.
- False Signals: If two or more trades near a level result in false signals, subsequent signals from that level should be ignored.
- Flat Markets: In flat conditions, pairs may generate many false signals or none at all. It's better to stop trading at the first signs of a flat market.
- Trading Hours: Open trades between the start of the European session and the middle of the US session, then manually close all trades.
- MACD Signals: On the hourly timeframe, trade MACD signals only during periods of good volatility and a clear trend confirmed by trendlines or trend channels.
- Close Levels: If two levels are too close (5–20 pips apart), treat them as a support or resistance zone.
- Stop Loss: Set a Stop Loss to breakeven after the price moves 15 pips in the desired direction.
Key Chart Elements:
Support and Resistance Levels: These are target levels for opening or closing positions and can also serve as points for placing Take Profit orders.
Red Lines: Channels or trendlines indicating the current trend and the preferred direction for trading.
MACD Indicator (14,22,3): A histogram and signal line used as a supplementary source of trading signals.
Important Events and Reports: Found in the economic calendar, these can heavily influence price movements. Exercise caution or exit the market during their release to avoid sharp reversals.
Forex trading beginners should remember that not every trade will be profitable. Developing a clear strategy and practicing proper money management are essential for long-term trading success.


