EUR/USD 5-Minute Analysis

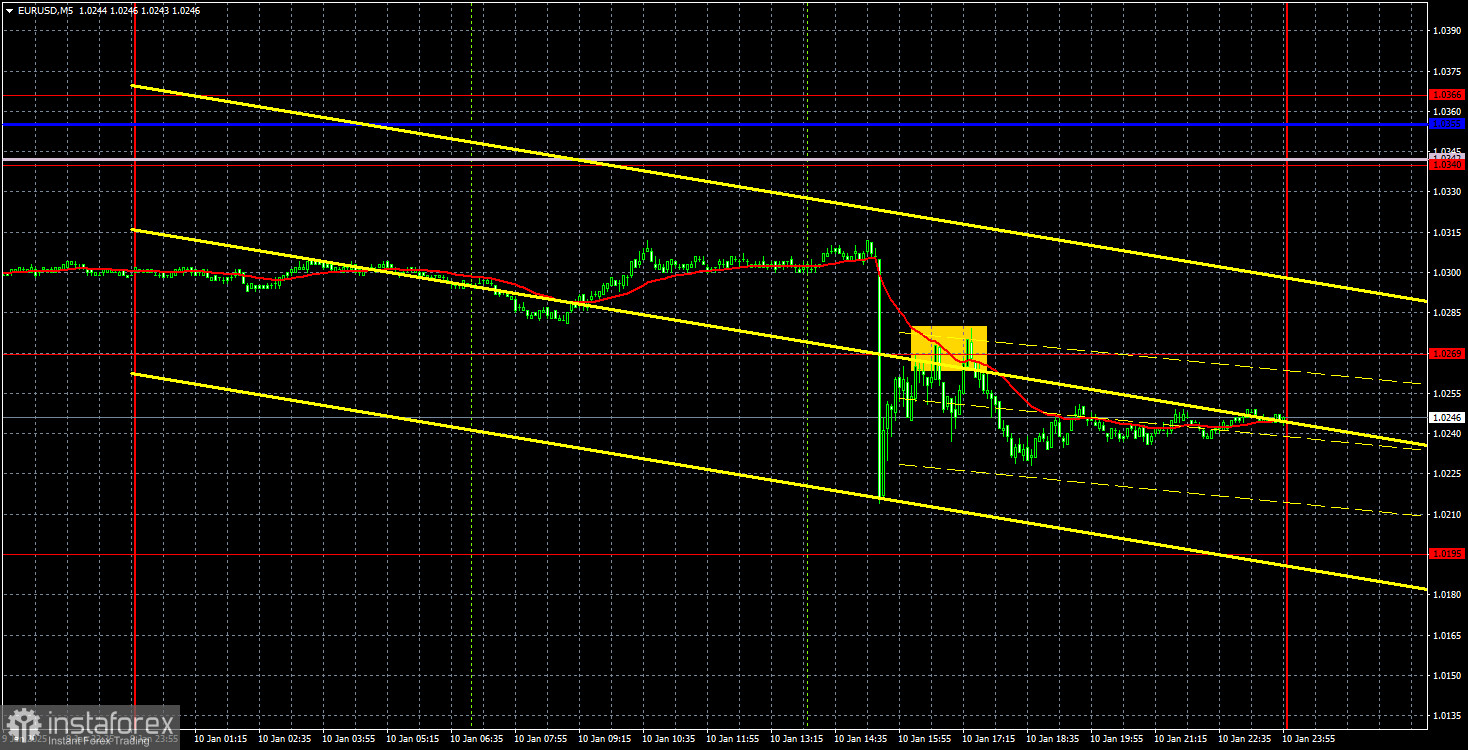
The EUR/USD pair experienced a sharp decline on Friday, with the entire drop occurring within just five minutes. Following the release of the Non-Farm Payrolls and unemployment data, the euro fell by nearly 100 pips. However, it's more accurate to say that the dollar gained 100 pips during this time. There is one notable detail that offers a glimmer of hope for the euro: it seems that the euro cannot depend on fundamental or macroeconomic support. Therefore, any help must come from technical factors. On Friday, the price failed to break below the previous local low, indicating that the market is not yet ready to sell the pair under the 1.0230 level. While this could be coincidental, it might also suggest a potential consolidation. The 4-hour timeframe indicates a likelihood of a flat market, with a tentative lower boundary at 1.0230 and an upper boundary at 1.0430.
On Friday, the NonFarm Payrolls report for December surpassed expectations, and the unemployment rate was lower than anticipated. This delivered the market the support it needed for further dollar purchases, following three months of consistent dollar buying. Given this context, it's surprising that the euro lost so little ground.
Despite the sharp movement in the currency pair on Friday, the decline was too sudden for effective trading. Traders who entered short positions ahead of time—based on the 4-hour timeframe—would have performed well. However, on the 5-minute timeframe, there was little opportunity to react to the U.S. reports. The only viable trades were two rebounds from the 1.0269 level.
COT Report

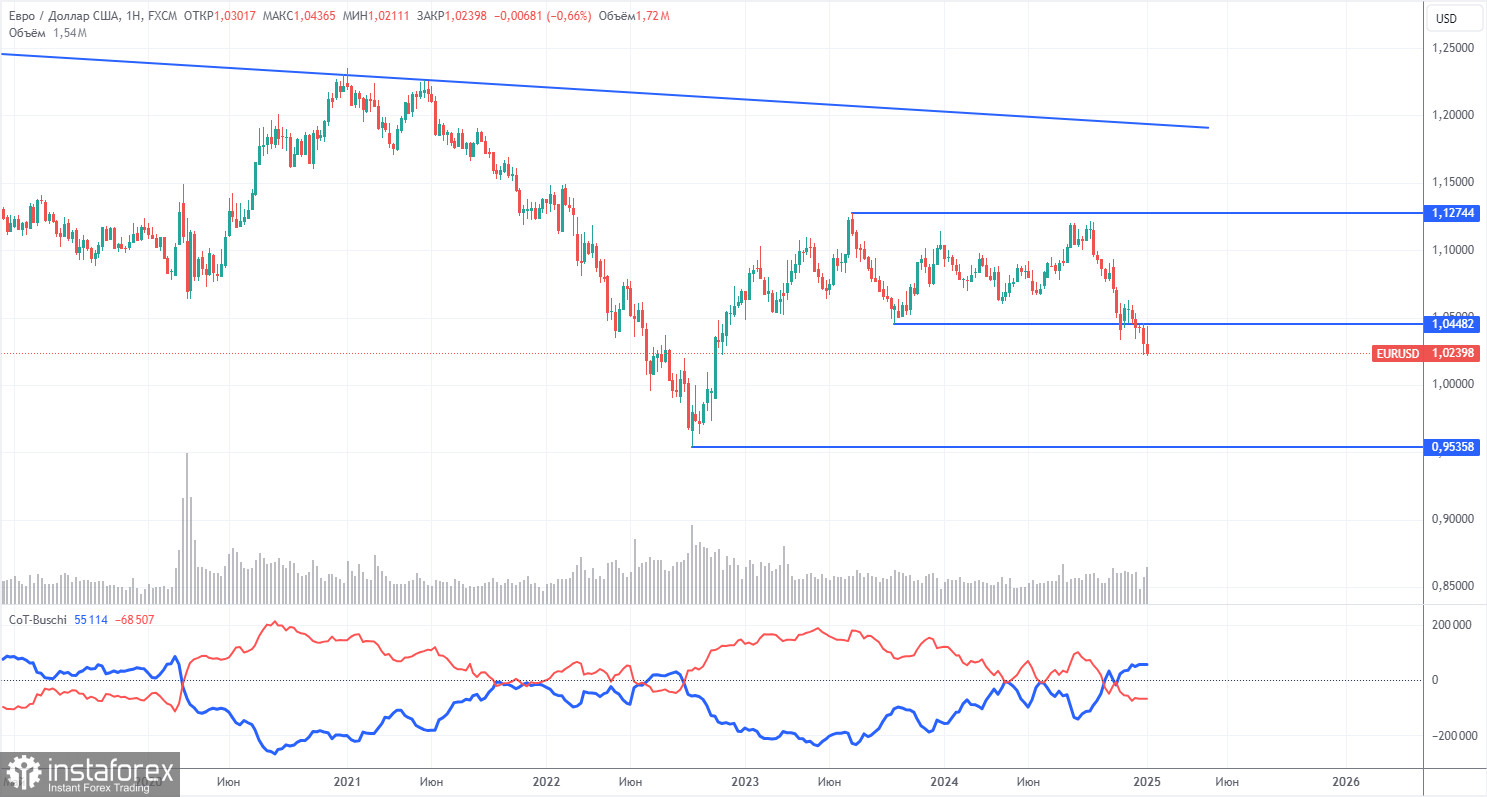
The latest Commitment of Traders (COT) report, dated December 31, indicates that non-commercial traders maintain a bullish net position. However, bears have recently gained the upper hand. Two months ago, the number of short positions among professional traders surged, resulting in a negative net position for the first time in a long while. This change suggests that the euro is being sold more frequently than it is being bought.
We have yet to identify any fundamental drivers for euro strength. From a technical perspective, the EUR/USD pair has been consolidating for quite some time. On the weekly timeframe, it has traded between 1.0448 and 1.1274 since December 2022. The breach of the 1.0448 level has opened the door for further declines.
Additionally, the COT data shows that the red and blue lines have crossed, signaling a bearish market sentiment. In the last reporting week, long positions among non-commercial traders increased by 9,300, while short positions rose by 10,400, resulting in a reduction of the net position by 1,100.
EUR/USD 1-Hour Analysis

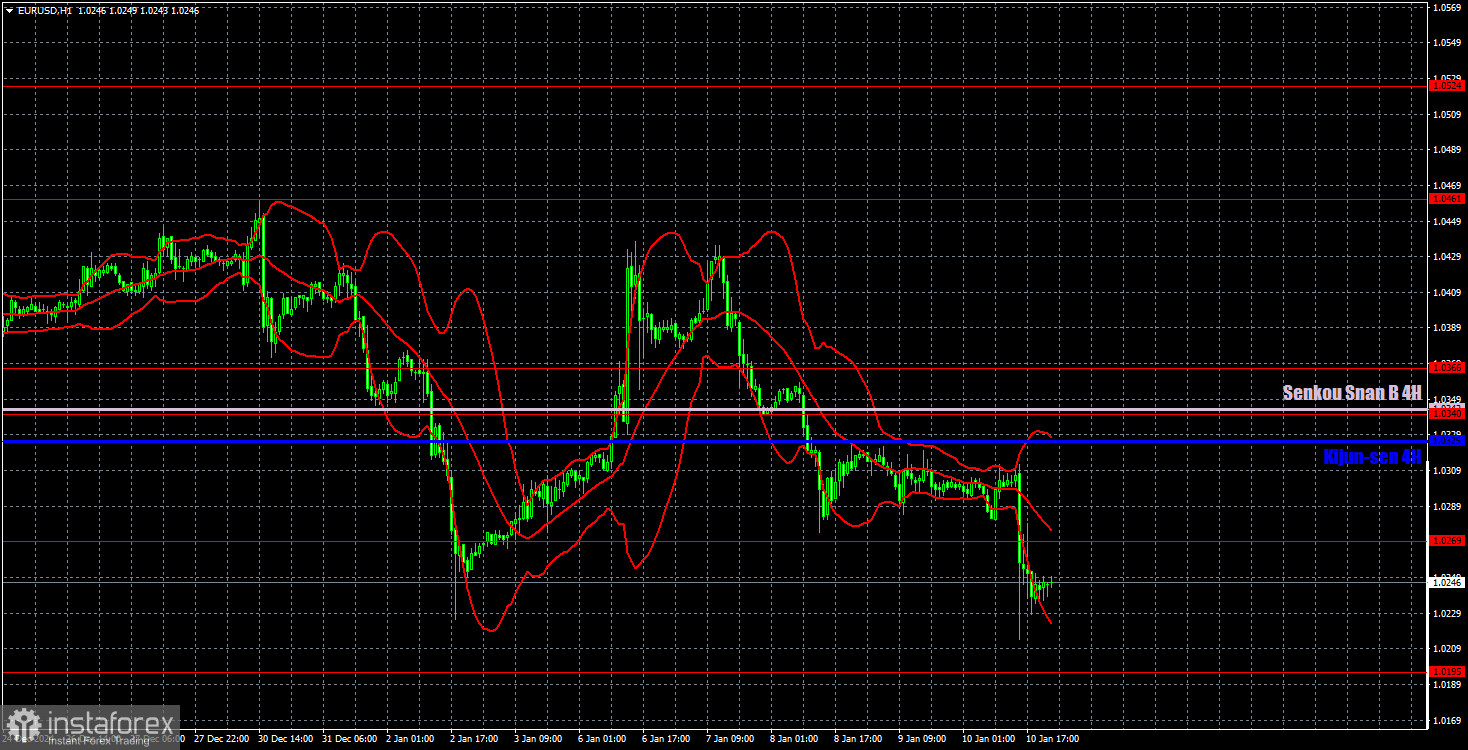
On the hourly timeframe, EUR/USD is once again attempting to resume its three-month downtrend. We believe that this decline will continue in the medium term. The Federal Reserve is expected to cut rates only once or twice in 2025, which is a more hawkish outlook than the market had anticipated. We maintain that there are no fundamental reasons to support significant growth for the euro. The pair remains bearish below the Ichimoku indicator lines.
Key trading levels are as follows: 1.0195, 1.0269, 1.0340–1.0366, 1.0461, 1.0524, 1.0585, 1.0658–1.0669, 1.0757, 1.0797, 1.0843, and 1.0889. Additionally, keep an eye on Senkou Span B (1.0342) and Kijun-sen (1.0325). Note that the Ichimoku lines may shift throughout the day, so traders should consider this when identifying signals. Remember to set a stop loss to breakeven if the price moves 15 pips in the desired direction, as this will help protect against potential losses from false signals.
No significant events are scheduled in the Eurozone or the U.S. on Monday. If the pair continues to retrace upward, the chances of a rise toward 1.0430 within the horizontal channel will increase. Conversely, any new attempts to break below 1.0230 will signal the market's readiness to continue selling the pair.
Illustration Explanations:
- Support and Resistance Levels (thick red lines): Thick red lines indicate where movement may come to an end. Please note that these lines are not sources of trading signals.
- Kijun-sen and Senkou Span B Lines: Ichimoku indicator lines transferred from the 4-hour timeframe to the hourly timeframe. These are strong lines.
- Extreme Levels (thin red lines): Thin red lines where the price has previously bounced. These serve as sources of trading signals.
- Yellow Lines: Trendlines, trend channels, or any other technical patterns.
- Indicator 1 on COT Charts: Represents the net position size for each category of traders.


