Analysis of Wednesday's Trades
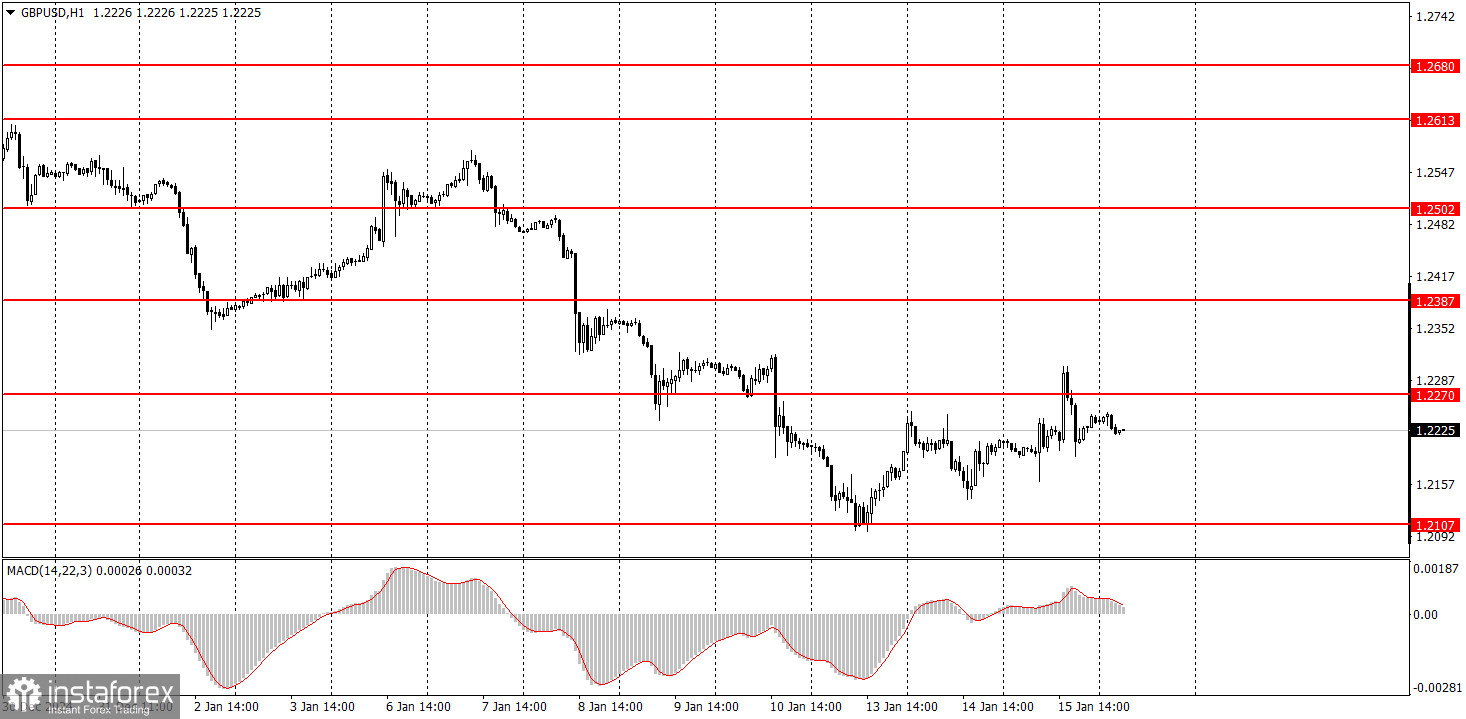
1H Chart of GBP/USD

The GBP/USD pair struggled to maintain its upward correction on Wednesday, similar to the EUR/USD pair, as its attempt ended poorly. The pound sterling faced a greater influence from key reports compared to the euro. However, neither the UK nor US inflation reports significantly changed the market outlook regarding the monetary policies of the Federal Reserve and the Bank of England.
In the UK, inflation showed signs of slowing, giving the BoE more flexibility to reduce the key interest rate more quickly and aggressively in 2025. In contrast, US inflation increased, allowing the Fed to uphold its current policy of inaction. Previously, market expectations indicated a 1% rate cut in the UK and a 0.5% cut in the US. Now, expectations for rate cuts in the UK have risen, while those for the US have declined. Consequently, the US dollar has additional reasons to strengthen, reinforcing a clear downtrend in the market.
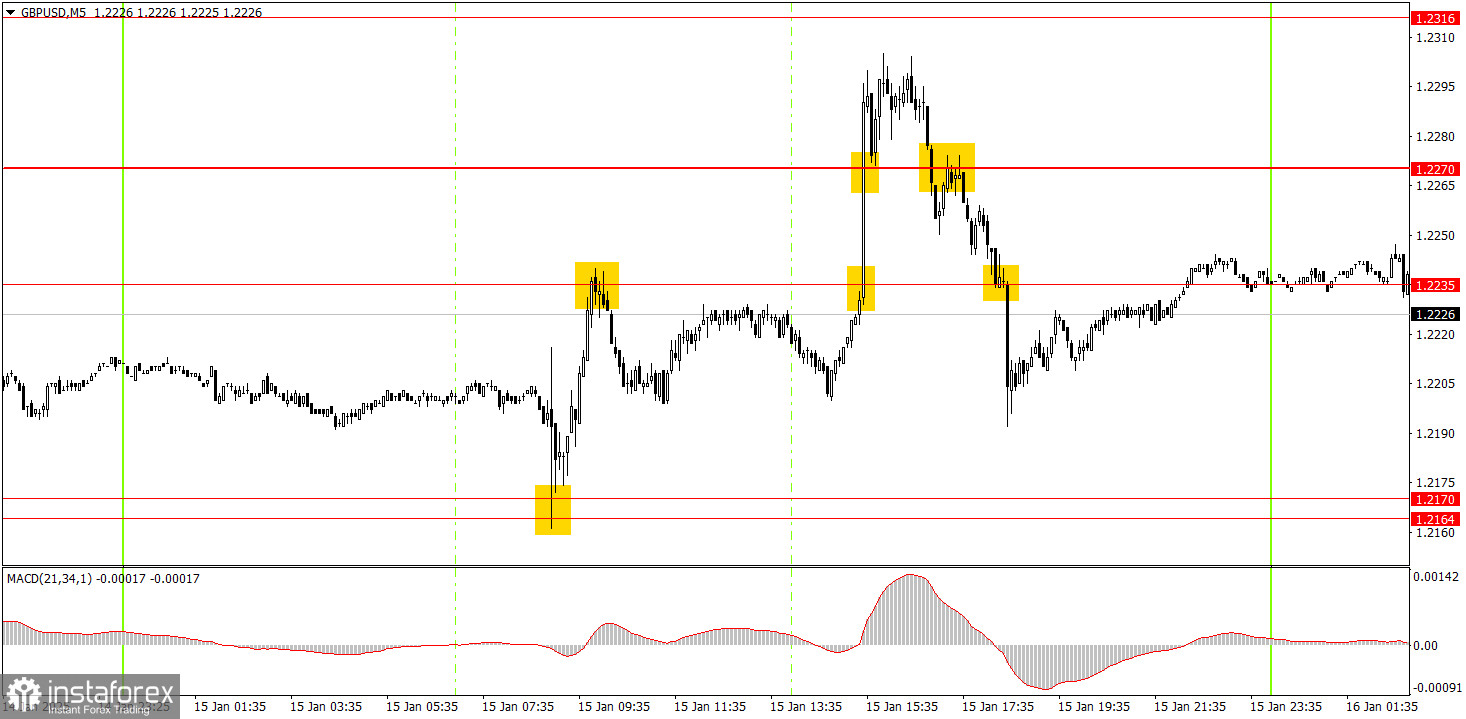
5M Chart of GBP/USD

On the 5-minute timeframe, several trading signals emerged on Wednesday. The first buy signal near the 1.2164–1.2170 range generated a profit of about 30 pips. The sell signal near the 1.2235 level likely closed at breakeven. After the release of the US inflation report, two buy signals were generated; however, it would have been wiser to disregard these since the pair had already shown significant growth earlier in the day. The last two sell signals were actionable, as the inflation reports generally indicated a renewed decline in the pair rather than an upward move.
Trading Strategy for Thursday:
On the hourly timeframe, GBP/USD continues to exhibit a downtrend, with the pound declining almost daily. In the medium term, we anticipate a continued decline toward the 1.1800 level, as this appears to be the most logical outcome. Therefore, expectations should remain focused on further declines, relying on technical signals as always.
On Thursday, GBP/USD is likely to trade more calmly; however, emotional spikes are still expected throughout the day due to various data releases from both the UK and the US.
On the 5-minute timeframe, key trading levels to watch include 1.2010, 1.2052, 1.2089-1.2107, 1.2164-1.2170, 1.2235, 1.2270, 1.2316, 1.2372-1.2387, 1.2445, 1.2502-1.2508, 1.2547, 1.2633, 1.2680-1.2685, 1.2723, and 1.2791-1.2798. On Thursday, the UK is scheduled to release its monthly GDP and industrial production data. While these reports are unlikely to provoke a strong reaction, a minor reaction could occur. In the US, the retail sales report will also be released.
Core Trading System Rules:
- Signal Strength: The shorter the time it takes for a signal to form (a rebound or breakout), the stronger the signal.
- False Signals: If two or more trades near a level result in false signals, subsequent signals from that level should be ignored.
- Flat Markets: In flat conditions, pairs may generate many false signals or none at all. It's better to stop trading at the first signs of a flat market.
- Trading Hours: Open trades between the start of the European session and the middle of the US session, then manually close all trades.
- MACD Signals: On the hourly timeframe, trade MACD signals only during periods of good volatility and a clear trend confirmed by trendlines or trend channels.
- Close Levels: If two levels are too close (5–20 pips apart), treat them as a support or resistance zone.
- Stop Loss: Set a Stop Loss to breakeven after the price moves 20 pips in the desired direction.
Key Chart Elements:
Support and Resistance Levels: These are target levels for opening or closing positions and can also serve as points for placing Take Profit orders.
Red Lines: Channels or trendlines indicating the current trend and the preferred direction for trading.
MACD Indicator (14,22,3): A histogram and signal line used as a supplementary source of trading signals.
Important Events and Reports: Found in the economic calendar, these can heavily influence price movements. Exercise caution or exit the market during their release to avoid sharp reversals.
Forex trading beginners should remember that not every trade will be profitable. Developing a clear strategy and practicing proper money management are essential for long-term trading success.


