Analysis of Trades and Trading Tips for the Japanese Yen
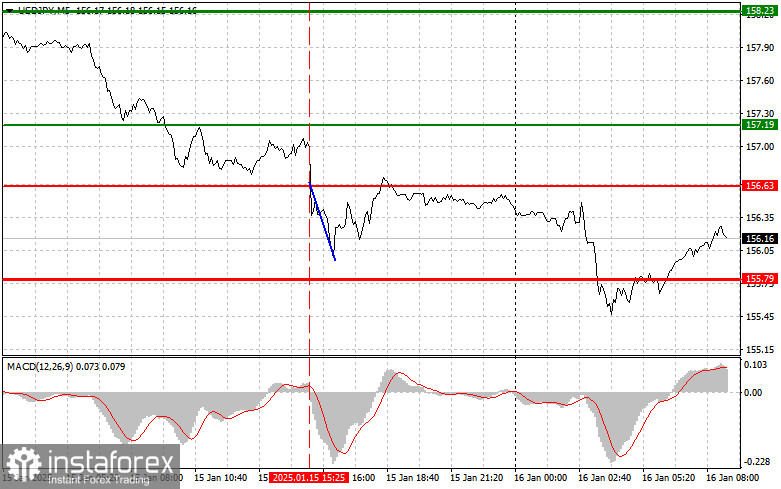
The test of the 156.63 level occurred when the MACD indicator had just begun to move downward from the zero level, confirming a valid entry point to sell the dollar. As a result, the pair decreased by approximately 60 pips.
Today's Producer Price Index (PPI) data from Japan prompted further buying of the yen against the dollar. Inflation rose by 0.3% month-over-month, while the annual growth reached an impressive 3.8%. The increase in producer prices is a critical signal for financial markets, leading to active investor responses. Rising inflation indicates sustained price pressures, which could potentially influence the country's monetary policy.
This current data reinforces expectations for possible monetary tightening by the Bank of Japan. Surveys suggest that the BOJ may raise rates at the upcoming meeting on January 24, with a potential increase of 0.5% by the end of March. However, the market remains vigilant regarding external economic factors, such as global inflation trends and policy changes by other central banks. Ensuring economic growth in Japan will be vital for the yen's continued strengthening and for the stability of financial markets.
Today, I will primarily focus on implementing Scenario #1 and Scenario #2.

Buy Signal
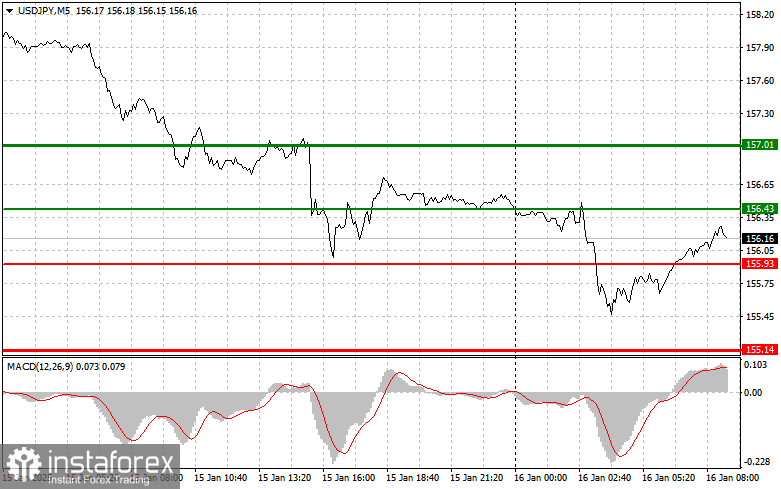
Scenario #1: Buy USD/JPY upon reaching the 156.43 level (green line on the chart) with a target of 157.01 (thicker green line). At 157.01, I plan to exit the long position and open a short position in the opposite direction, aiming for a 30-35 pip correction. Be cautious with longs, as downward pressure on the pair may return anytime. Important: Before buying, ensure that the MACD indicator is above the zero level and starting to rise.
Scenario #2: Buy USD/JPY if there are two consecutive tests of the 155.93 level while the MACD indicator is in the oversold zone. This will limit the pair's downward potential and lead to an upward market reversal. The expected targets are the 156.43 and 157.01 levels.
Sell Signal
Scenario #1: Sell USD/JPY after breaking below the 155.93 level (red line on the chart), which is expected to trigger a sharp decline in the pair. The key target for sellers will be 155.14, where I plan to exit the short position and open a long position in the opposite direction, targeting a 20-25 pip correction. Downward pressure on the pair is expected to persist today. Important: Before selling, ensure that the MACD indicator is below the zero level and starting to decline.
Scenario #2: Sell USD/JPY if there are two consecutive tests of the 156.43 level while the MACD indicator is in the overbought zone. This will limit the pair's upward potential and lead to a market reversal downward. The expected targets are the 155.93 and 155.14 levels.

Chart Notes
- Thin green line: Entry price for buying the trading instrument.
- Thick green line: A suggested target for Take Profit or manually locking in profits, as further growth above this level is unlikely.
- Thin red line: Entry price for selling the trading instrument.
- Thick red line: A suggested target for Take Profit or manually locking in profits, as further decline below this level is unlikely.
- MACD Indicator: Critical for identifying overbought and oversold zones to guide market entry decisions.
Important Note for Beginner Traders
- Always approach market entry decisions cautiously.
- Avoid trading during major news releases to sidestep volatile price swings.
- If trading during news releases, always set stop-loss orders to minimize losses.
- Trading without stop-loss orders or money management practices can quickly deplete your deposit, especially when using large volumes.
- A clear trading plan, like the one outlined above, is essential for successful trading. Spontaneous trading decisions based on current market conditions are inherently disadvantageous for intraday traders.


