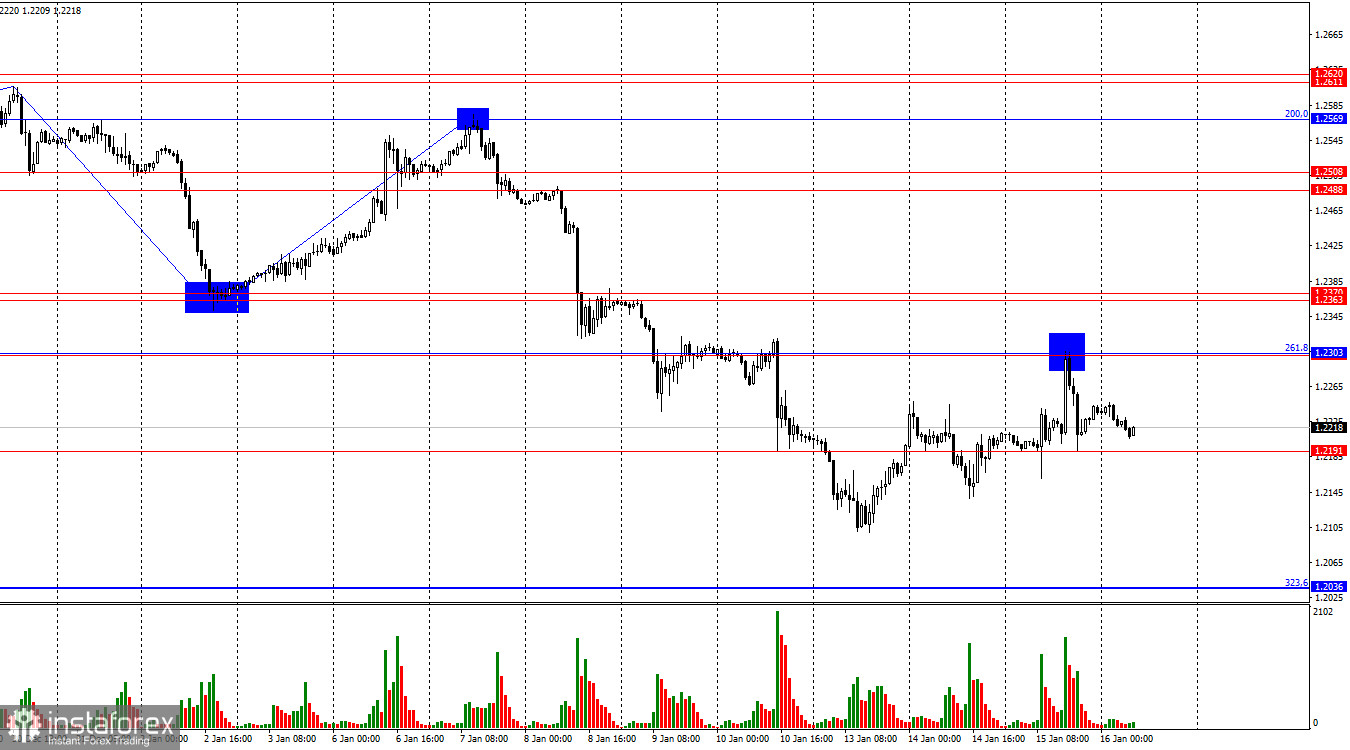
On the hourly chart, GBP/USD rose to the Fibonacci 261.8% level at 1.2303, rebounded from it, and fell to the 1.2191 level. Consolidation below this level will signal continued bearish momentum, targeting the corrective level of 323.6% – 1.2036. A rebound from 1.2191, on the other hand, could favor a return to 1.2303.

The wave structure leaves no doubts. The last completed upward wave failed to break the previous high, while the last downward wave broke the previous low. This confirms the formation of a bearish trend, which remains intact. For a reversal, GBP/USD would need to rise to at least 1.2569 and firmly close above this level. Such a scenario seems unlikely in the near term.
On Wednesday, the UK released an inflation report that surprised traders. The Consumer Price Index (CPI) fell from 2.6% to 2.5% year-over-year, despite the Bank of England's repeated projections of rising inflation in 2025. Core inflation also declined from 3.5% to 3.2%, further surprising the market.
The drop in inflation has made it challenging for the pound to find market support. Bullish hopes largely rely on high UK inflation levels, which would deter the Bank of England from dovish monetary actions. However, declining inflation shifts the outlook toward potential policy easing.
Thursday's morning UK data also failed to impress. Industrial production fell by 0.4% (against expectations of a +0.1% rise), while GDP for November increased by only 0.1% (compared to forecasts of 0.2% month-on-month). If bears manage to close below 1.2191, there is little to stop them from driving the pair towards 1.2036. With such economic reports, the pound could remain under pressure for an extended period.

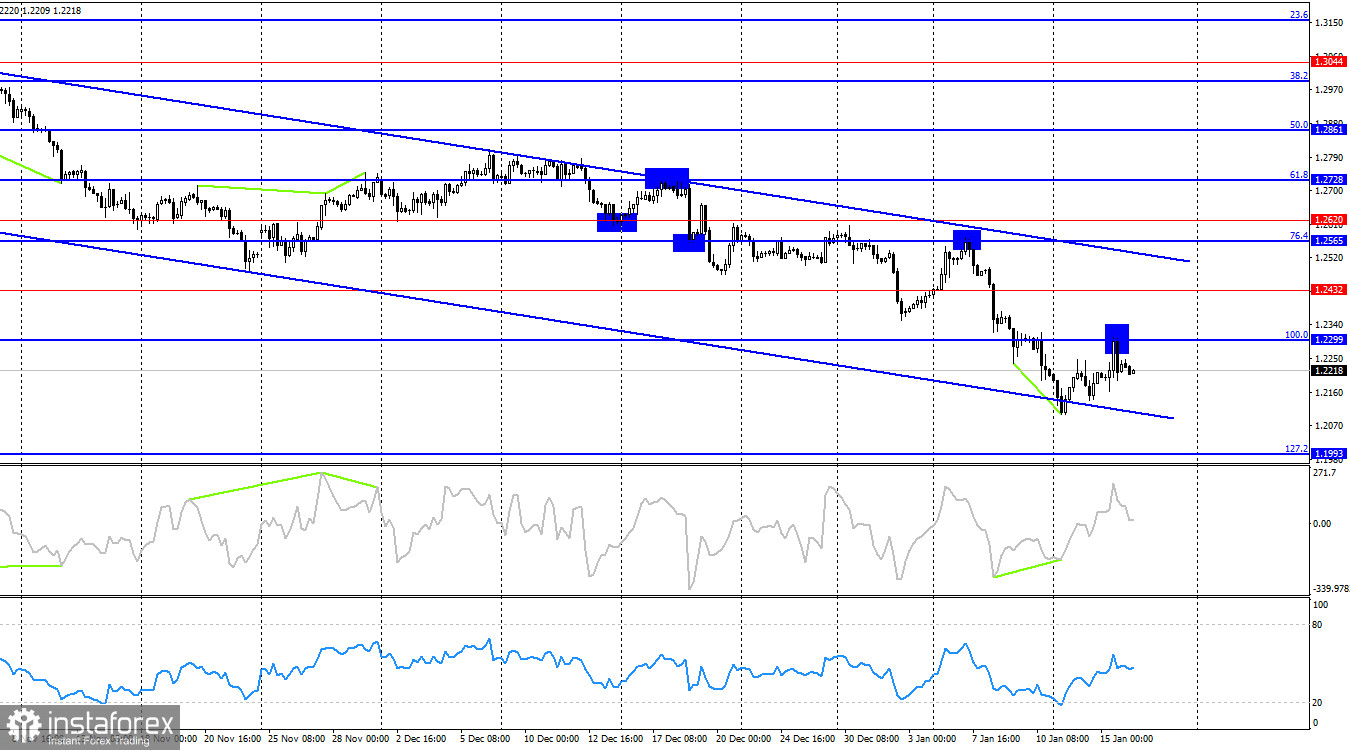
On the 4-hour chart, the pair rebounded from the 100.0% Fibonacci retracement level at 1.2299, paving the way for a move toward 127.2% – 1.1993. A downward trend channel highlights the dominance of bears, which they are unlikely to relinquish anytime soon. Only a breakout above the channel would suggest a strong recovery for the pound.
Commitments of Traders (COT) Report

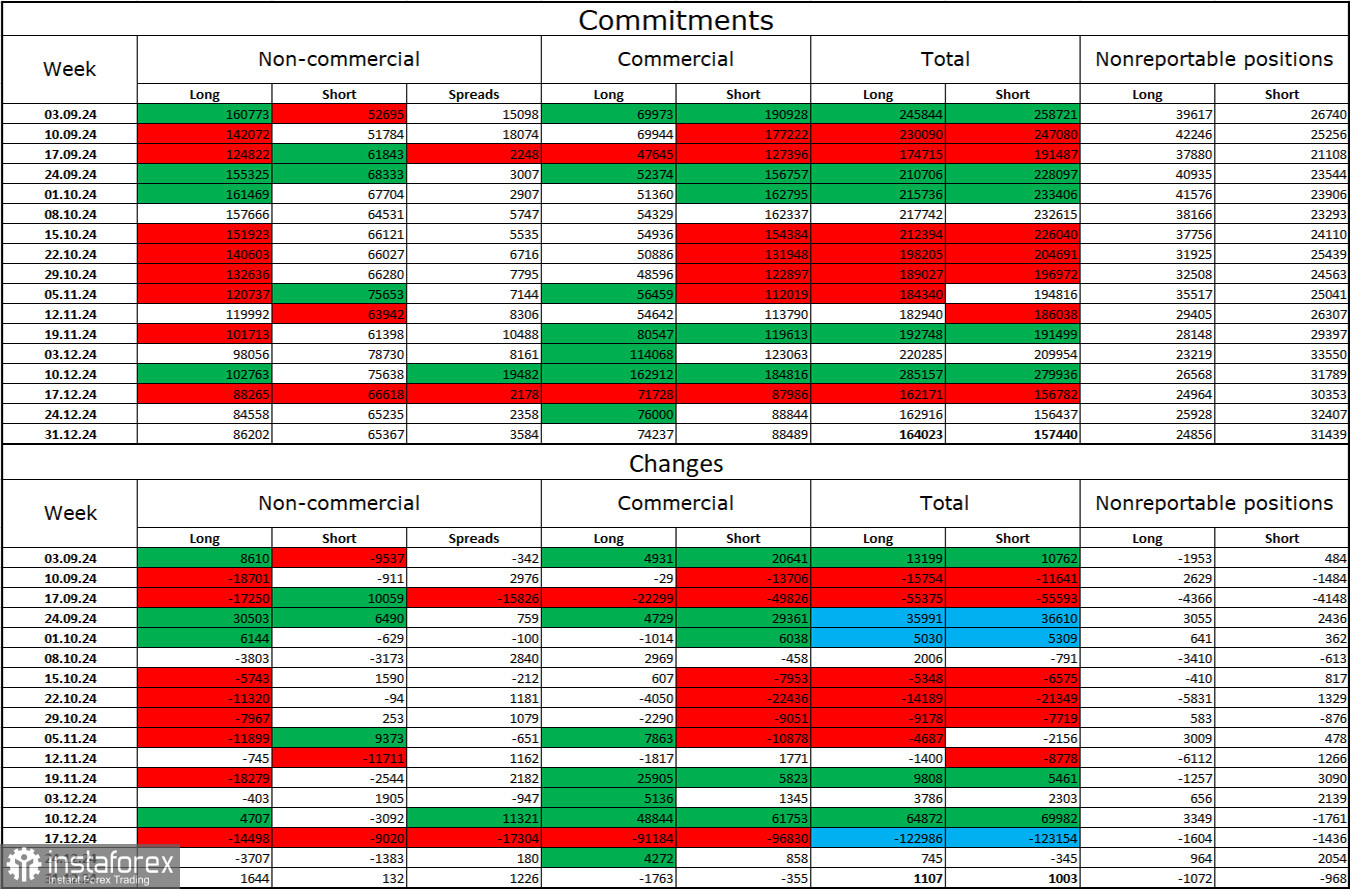
The sentiment among Non-commercial traders showed minimal changes in the latest reporting week. The number of long positions held by speculators increased by 1,644, while short positions grew by 132. Bulls maintain a slight advantage, but it continues to erode. The gap between long and short positions has narrowed to just 21,000: 86,000 vs. 65,000.
In my view, the pound still faces a bearish outlook. COT reports indicate a steady buildup of bearish positions almost every week. Over the last three months, long positions have fallen from 160,000 to 86,000, while short positions have risen from 52,000 to 65,000. Professional traders are likely to continue reducing their longs or increasing shorts, as most bullish factors for the pound have already been priced in. Technical analysis also supports a bearish outlook.
News Calendar for the UK and the US:
- UK: GDP change for November (07:00 UTC)
- UK: Industrial Production Change (07:00 UTC)
- US: Retail Sales Change (13:30 UTC)
- US: Initial Jobless Claims Change (13:30 UTC)
- US: Philadelphia Manufacturing Index (13:30 UTC)
Thursday's economic calendar includes five key events, the most important of which have already been published. The impact of the remaining data on market sentiment is expected to be moderate.
GBP/USD Forecast and Trading Tips
- Sales: The pair was sellable on a rebound from 1.2303 on the hourly chart, targeting 1.2191 and 1.2036. The first target has been reached; maintaining positions below this level will allow traders to aim for the second target.
- Purchases: I do not recommend considering long positions today.
Fibonacci Levels
- Hourly Chart: Built between 1.3000–1.3432
- 4-Hour Chart: Built between 1.2299–1.3432


