Analysis of Friday's Trades
1H Chart of EUR/USD

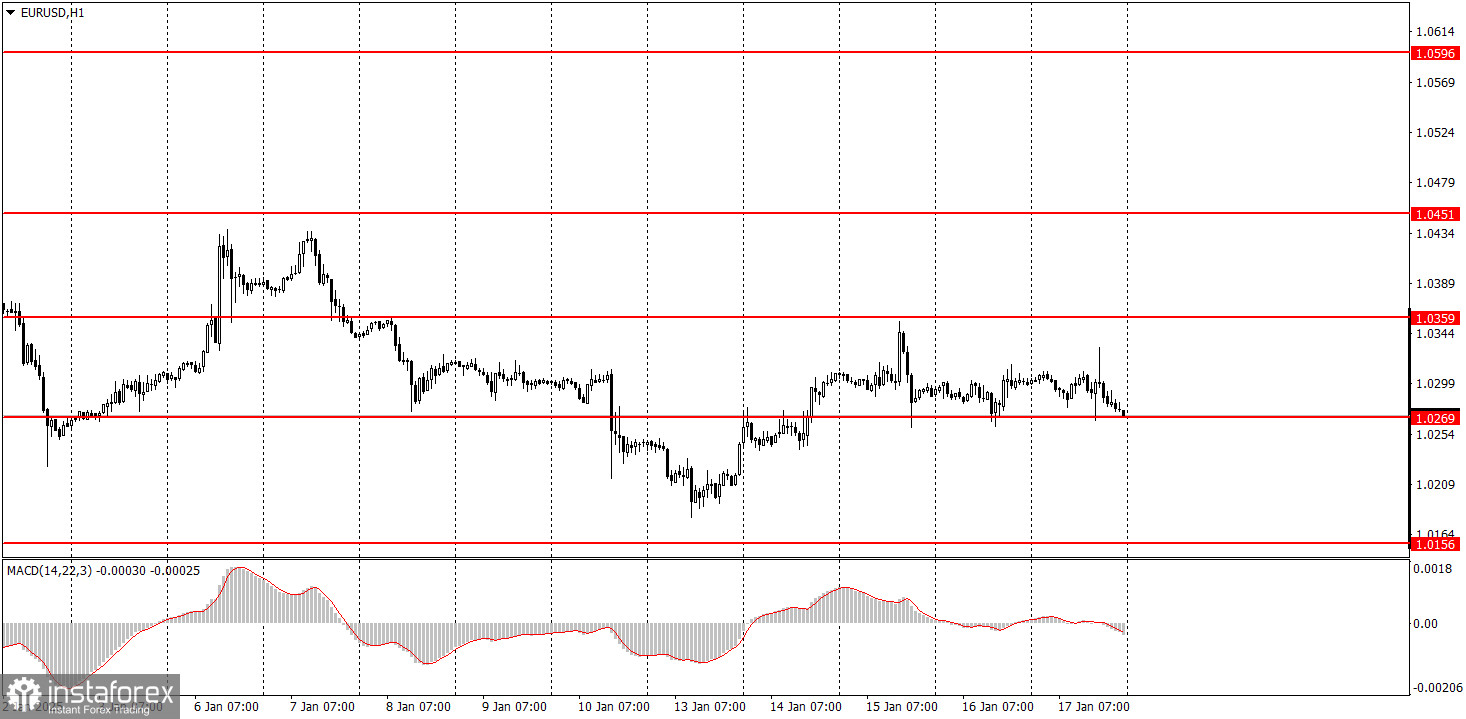
The EUR/USD currency pair traded sideways on Friday. While we don't consider the euro to be in a flat market just yet, the last three trading days of the week were confined between 1.0269 and 1.0359. These movements were influenced by a weak macroeconomic backdrop.
We previously noted that although there were several reports released, none were particularly significant for the market. Consequently, the market's response to these reports was short-lived and did not affect the overall technical landscape, which was reflected in practice.
A more noteworthy observation is that the pair, while remaining near its two-year lows, has struggled to move away from these levels, as clearly seen on higher timeframes. This indicates that the market is taking intermittent pauses, showing up on the charts as minor pullbacks or sideways movements. We maintain the belief that the euro will continue to decline, and at this time, there are no indications to expect a bullish reversal.
5M Chart of EUR/USD

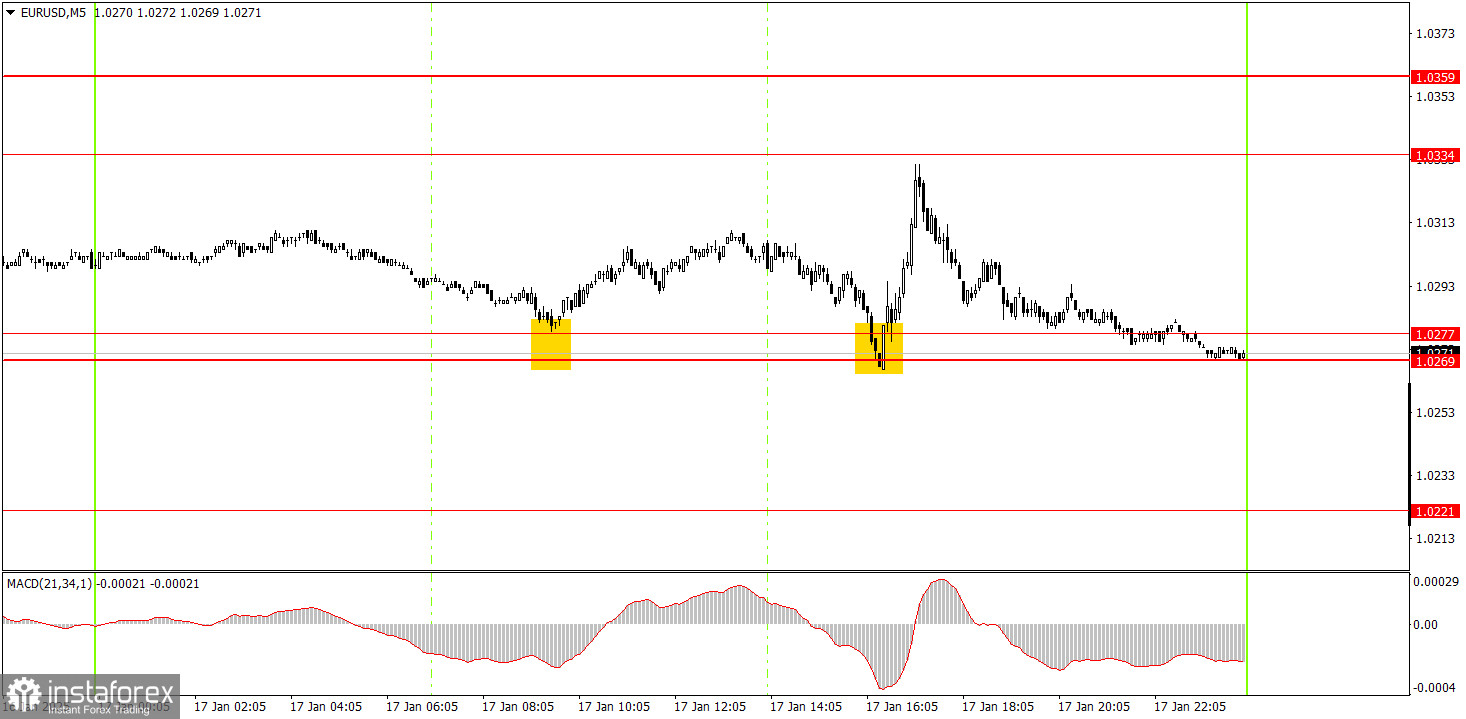
On the 5-minute timeframe, Friday generated two excellent buy signals. The price rebounded twice from the 1.0269-1.0277 zone. Although buy signals typically do not take precedence in a strong bearish trend, these trades were profitable on Friday. In the first instance, the price rose by approximately 20 pips. In the second instance, the price increased by around 45 pips, coming within just 3 pips of the next target level.
Trading Strategy for Monday:
On the hourly timeframe, the EUR/USD pair remains in a downtrend. We believe that the euro's decline has resumed in the medium term, with parity now within reach. As previously mentioned, the euro is expected to continue falling due to a supportive fundamental and macroeconomic environment for the US dollar.
Movements may be subdued on Monday, with the euro likely leaning towards further declines. We anticipate that the 1.0269-1.0277 zone will soon be breached.
On the 5-minute timeframe, the following levels should be considered: 1.0156, 1.0221, 1.0269-1.0277, 1.0334-1.0359, 1.0433-1.0451, 1.0526, 1.0596, 1.0678, 1.0726-1.0733, 1.0797-1.0804, and 1.0845-1.0851. On Monday, there are no major events or reports scheduled in the Eurozone or the US. As a result, movements are likely to remain weak, with the price possibly staying within the range of 1.0269-1.0359 for another day.
Core Trading System Rules:
- Signal Strength: The shorter the time it takes for a signal to form (a rebound or breakout), the stronger the signal.
- False Signals: If two or more trades near a level result in false signals, subsequent signals from that level should be ignored.
- Flat Markets: In flat conditions, pairs may generate many false signals or none at all. It's better to stop trading at the first signs of a flat market.
- Trading Hours: Open trades between the start of the European session and the middle of the US session, then manually close all trades.
- MACD Signals: On the hourly timeframe, trade MACD signals only during periods of good volatility and a clear trend confirmed by trendlines or trend channels.
- Close Levels: If two levels are too close (5–20 pips apart), treat them as a support or resistance zone.
- Stop Loss: Set a Stop Loss to breakeven after the price moves 15 pips in the desired direction.
Key Chart Elements:
Support and Resistance Levels: These are target levels for opening or closing positions and can also serve as points for placing Take Profit orders.
Red Lines: Channels or trendlines indicating the current trend and the preferred direction for trading.
MACD Indicator (14,22,3): A histogram and signal line used as a supplementary source of trading signals.
Important Events and Reports: Found in the economic calendar, these can heavily influence price movements. Exercise caution or exit the market during their release to avoid sharp reversals.
Forex trading beginners should remember that not every trade will be profitable. Developing a clear strategy and practicing proper money management are essential for long-term trading success.


