EUR/USD 5-Minute Analysis

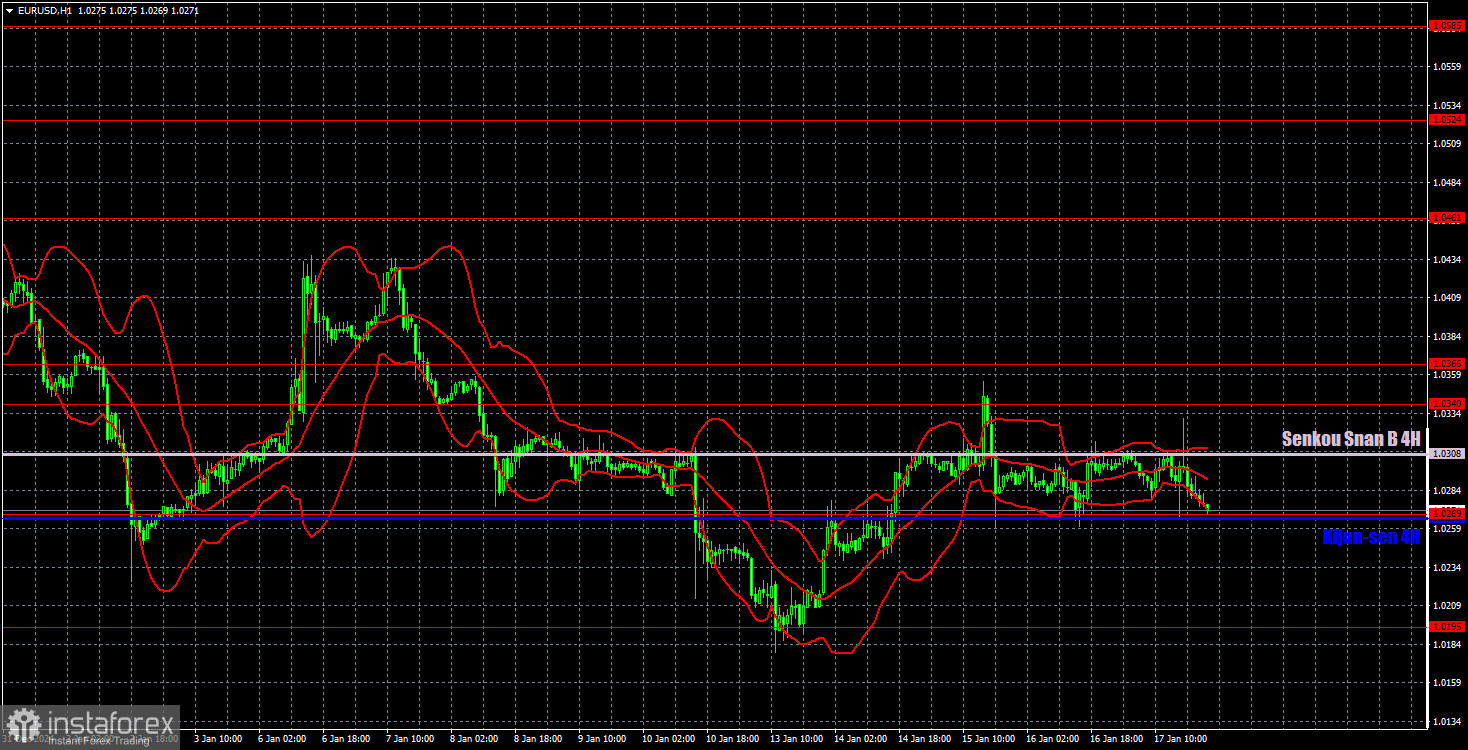
The EUR/USD currency pair traded within a narrow range on Friday. On the hourly timeframe, the movement appears flat; however, on the 4-hour timeframe, it is evident that the pair experienced a slight upward correction before declining again. Therefore, we believe that a new decline in the euro is likely to occur soon—potentially as early as today, coinciding with Donald Trump's inauguration as President of the United States. While we do not expect this event to necessarily lead to a rise in the dollar, unexpected developments today seem inevitable.
Reflecting on last Friday and the entire week, it is evident that there are still no compelling reasons for the euro to strengthen. U.S. data released on Friday regarding industrial production, new housing starts, and building permits showed strong figures, providing a solid foundation for the dollar's growth. This theme dominated the previous week. Each time the euro attempted a correction, new data came out, compelling the market to continue selling. We believe that the previous week should have concluded with a significant rise in the U.S. dollar. The absence of such an increase suggests that the dollar may still be undervalued.
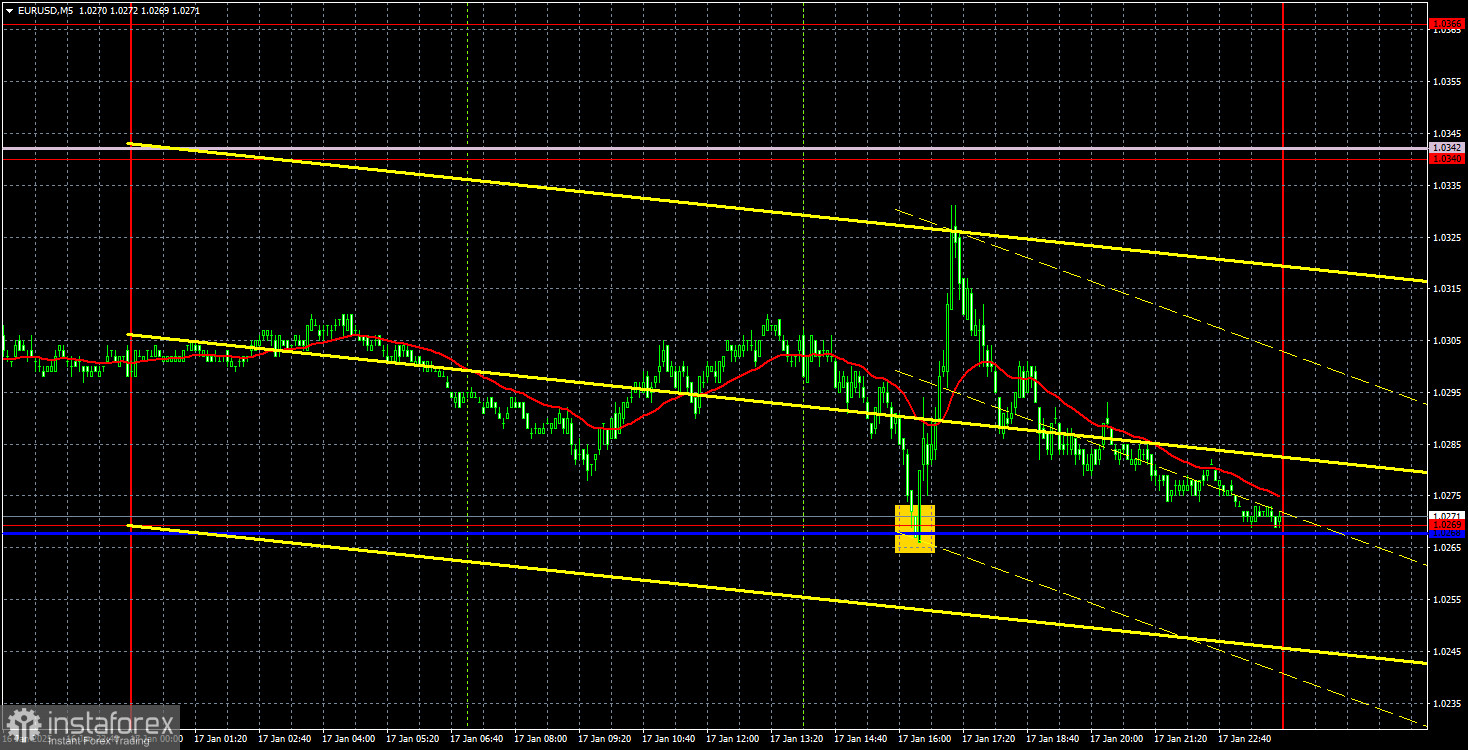
On the 5-minute timeframe, there was one notable buy signal on Friday. During the U.S. trading session, the price rebounded off the Kijun-sen line, moving upward by 50 pips. However, it fell short of reaching the target level of 1.0340, instead retreating back to the critical line by the end of the day. This provided traders with an opportunity to open long positions and close them for a profit, depending on the timing of their exits.
COT Report

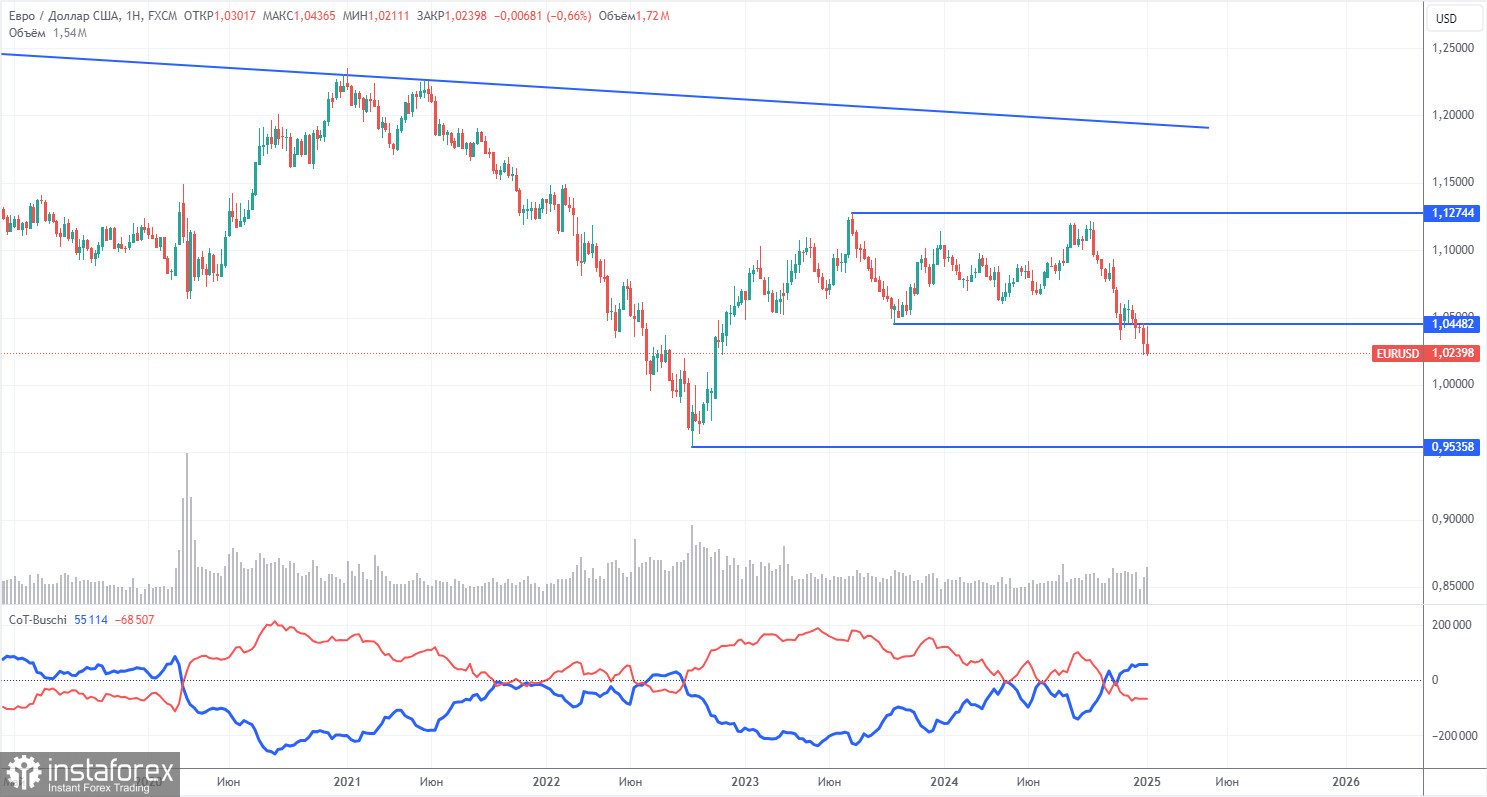
The latest Commitment of Traders (COT) report was released on December 31. The accompanying chart shows that non-commercial traders have maintained a predominantly bullish net position; however, the bears have started to take control. Two months ago, we saw a significant increase in the number of short positions opened by professional traders, resulting in a negative net position for the first time in a long while. This suggests that the euro is now being sold more frequently than it is being bought.
Currently, there are no fundamental factors supporting a strengthening of the euro. Technical analysis has indicated that the currency pair has been consolidating, essentially trading within a flat range. On the weekly timeframe, it is evident that since December 2022, the pair has fluctuated between the levels of 1.0448 and 1.1274. However, a break below 1.0448 has created potential for a more substantial decline.
At present, the red and blue lines on the chart have crossed and reversed their positions relative to one another, signaling a bearish market trend. During the last reporting week, the number of long positions in the non-commercial group increased by 9,300, while short positions rose by 10,400. Consequently, the net position decreased by 1,100.
EUR/USD 1-Hour Analysis

On the hourly timeframe, the currency pair has continued its downtrend, which has persisted for over three months. We believe that this decline will continue in the medium term. The Federal Reserve may only cut rates 1 to 2 times in 2025, which represents a much more hawkish stance compared to the market's previous expectations. This factor, among others, will continue to support the U.S. dollar. Currently, the euro is trading within a flat range, but this may not last much longer.
For January 20, we highlight the following trading levels: 1.0124, 1.0195, 1.0269, 1.0340–1.0366, 1.0461, 1.0524, 1.0585, 1.0658–1.0669, 1.0757, 1.0797, and 1.0843, along with the Senkou Span B (1.0308) and Kijun-sen (1.0266) lines. Please note that the lines of the Ichimoku indicator may move during the day, which should be considered when identifying trading signals. It is advisable to place a Stop Loss at breakeven if the price moves 15 pips in the desired direction. This will help protect against potential losses if the signal turns out to be false.
No major economic events are scheduled in the Eurozone or the U.S. on Monday; however, Donald Trump's inauguration will occur, which is a significant event. While this may lead to strong movements in the forex market, such movements are not guaranteed.
Illustration Explanations:
- Support and Resistance Levels (thick red lines): Thick red lines indicate where movement may come to an end. Please note that these lines are not sources of trading signals.
- Kijun-sen and Senkou Span B Lines: Ichimoku indicator lines transferred from the 4-hour timeframe to the hourly timeframe. These are strong lines.
- Extreme Levels (thin red lines): Thin red lines where the price has previously bounced. These serve as sources of trading signals.
- Yellow Lines: Trendlines, trend channels, or any other technical patterns.
- Indicator 1 on COT Charts: Represents the net position size for each category of traders.


