


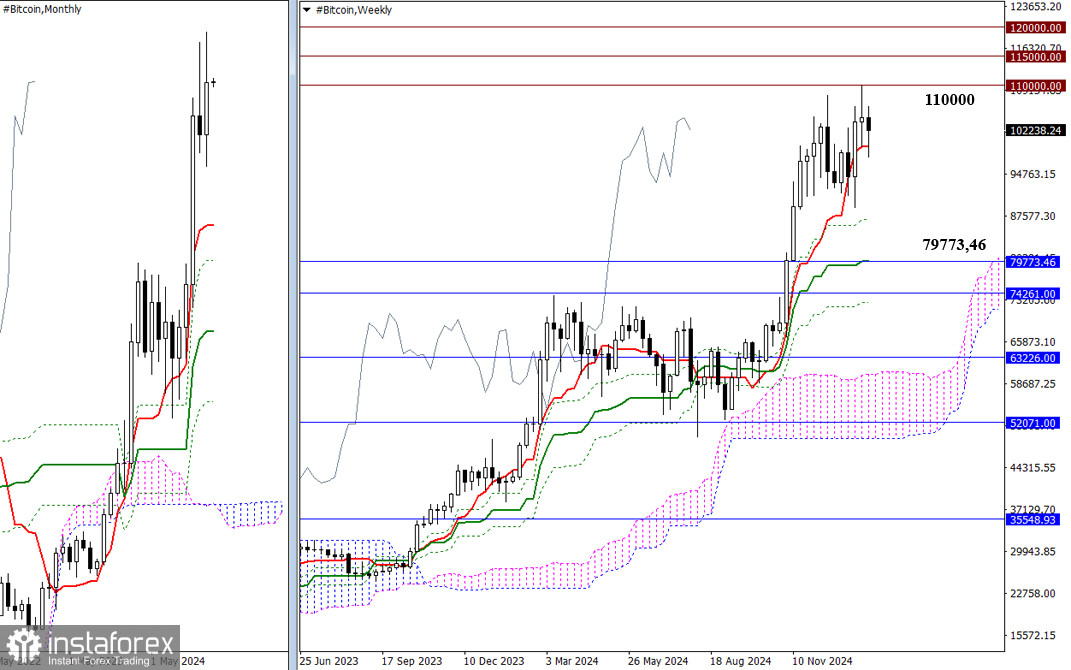
In January, Bitcoin reached a new all-time high, approaching the psychological level of $110,000. However, there was no significant upward momentum during the month. This stagnation, along with the detachment from the monthly short-term trend at $79,773.46, could lead to a downward correction. If bulls can maintain the upward movement, new historical highs may be possible, with psychological targets at $115,000 and $120,000.
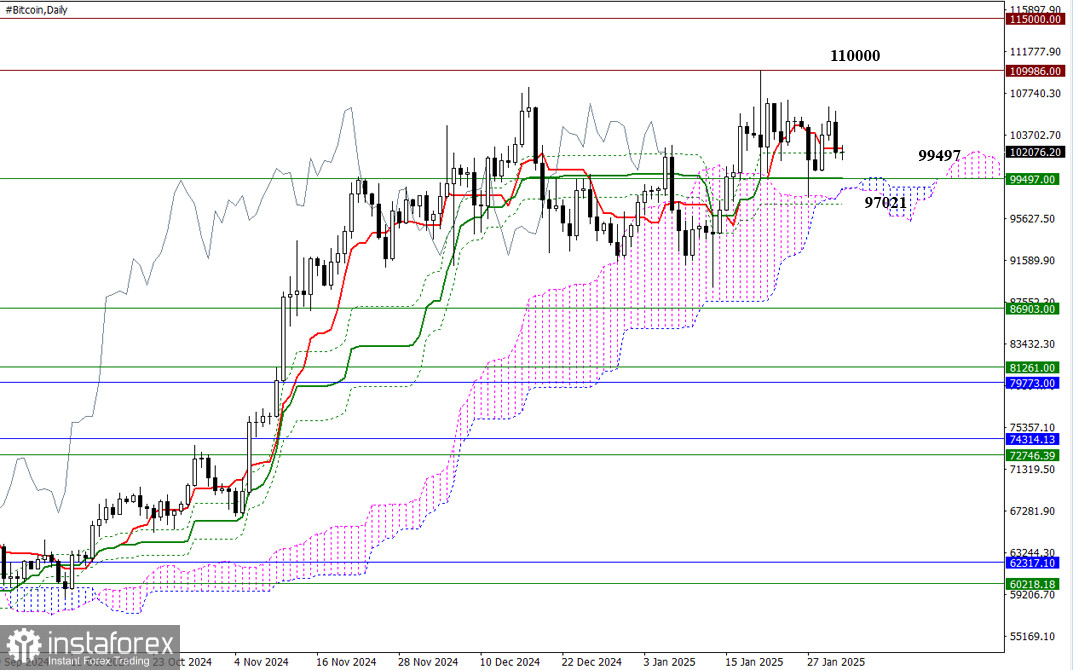
On the daily timeframe, the market is currently exhibiting sideways movement and uncertainty around the daily short-term trend at 102,383. For the bulls to gain momentum and break free from this uncertainty, they need to overcome the tested resistance at 110,000 and aim for new highs. On the other hand, if the bears take control, they must target the weekly short-term trend at 99,497, break through the daily range between 99,497 and 97,021, and establish a position in the bearish zone relative to the daily Ichimoku cloud at 98,457. Successfully achieving these milestones will open up new bearish opportunities.
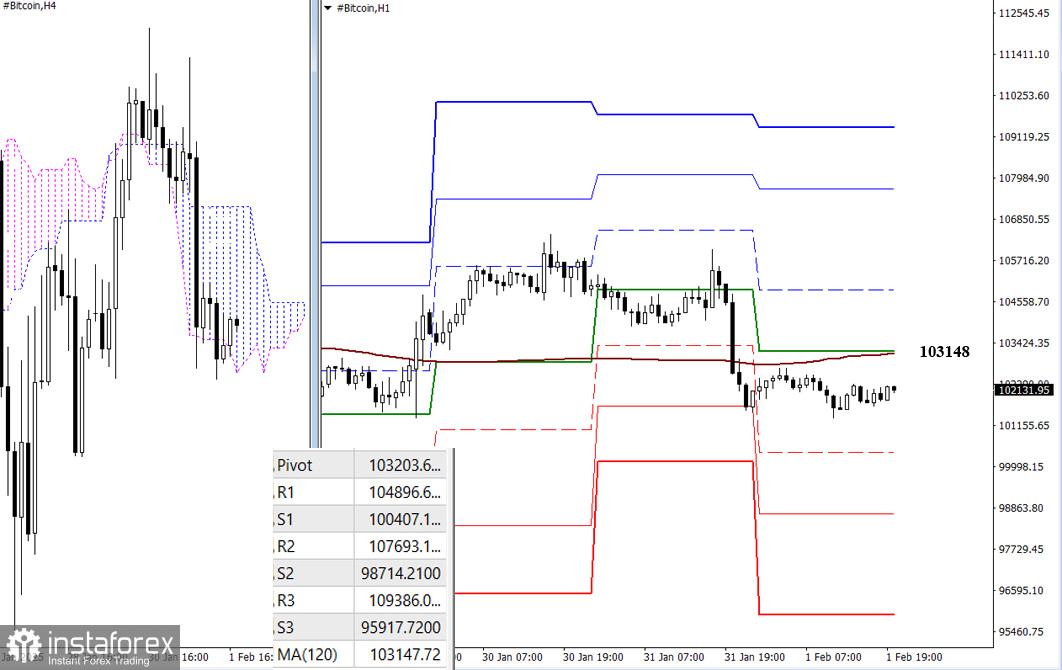
Currently, on the lower timeframes, Bitcoin is fluctuating around the weekly long-term trend level of 103,148. This movement is happening without significant changes in the angle of the trend, indicating a state of uncertainty in the market. Any development of a clear directional movement will alter the current balance of power and affect the slope of the trend. For intraday bullish traders, the classic Pivot resistance levels will be important reference points, while bearish traders will look to the classic Pivot support levels for guidance. Please note that Pivot levels are updated daily.
***
Technical Analysis Components:
- Higher Timeframes: Ichimoku Kinko Hyo (9.26.52) and Fibonacci Kijun levels
- H1: Classic Pivot Points and 120-period Moving Average (weekly long-term trend)


