


EUR/USD
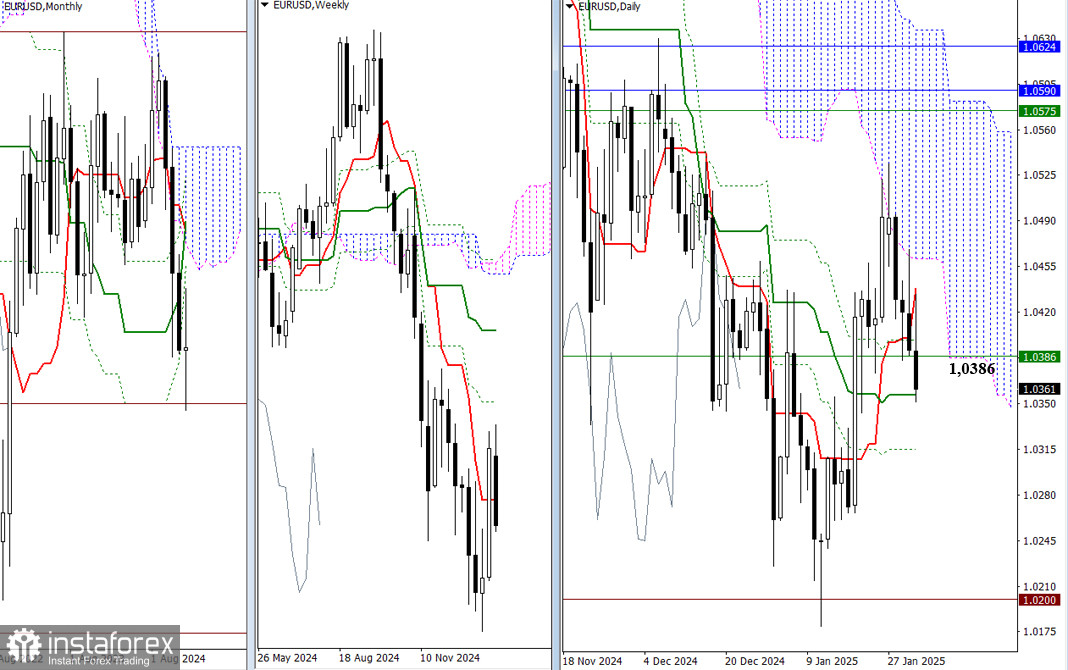
Bearish players are currently dominant in the market. Over the past week, they have executed a daily corrective decline, reaching the medium-term trend level at 1.0356. January closed with a candle that shows uncertainty, featuring long shadows and a minimal body. This situation may lead to a consolidation phase centered around the weekly short-term trend at 1.0386, with boundaries defined by the daily Ichimoku cross levels at 1.0438, 1.0356, and 1.0315. A breakout beyond these key points will allow for more extensive planning. For bullish players, entering the daily cloud at 1.0464 will be crucial, as it creates an opportunity to advance toward the upper boundary at 1.0581, which is reinforced by multiple resistance levels from higher timeframes. Conversely, for bearish players, breaking below the daily Ichimoku cross at 1.0315 will open the path to historical support at 1.0200, which has been tested previously, and the low extreme at 1.0179. A breakout below these levels will signal a restoration of the global downtrend.
H4 – H1
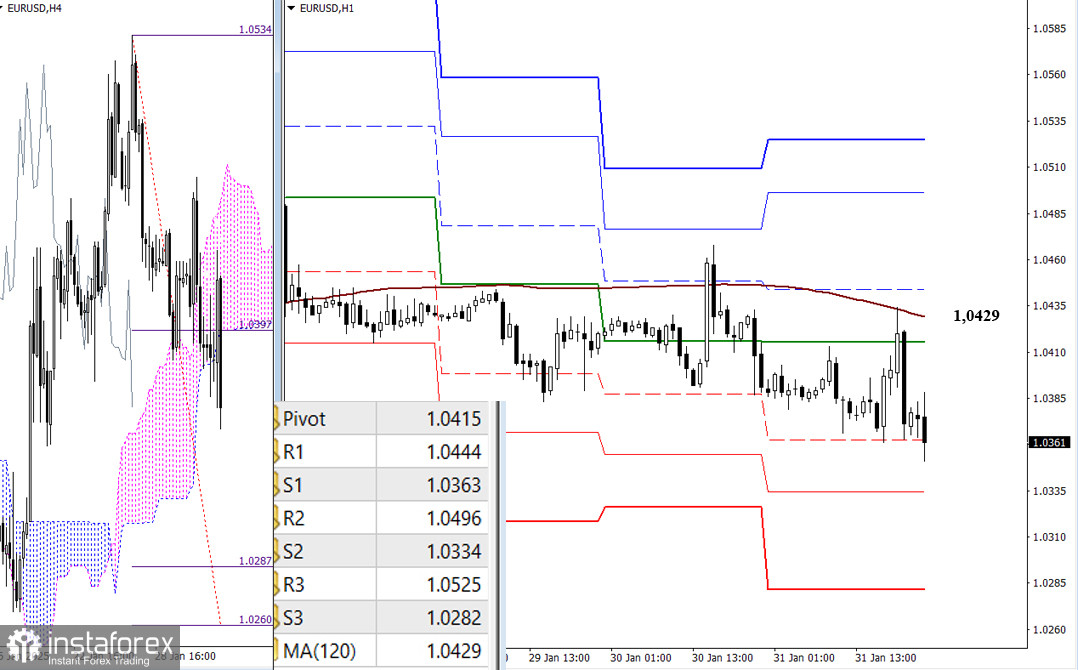
On the lower timeframes, bearish traders have consolidated below the weekly long-term trend at 1.0429 and are currently in control. A bearish target has emerged on the H4 chart, indicating a potential breakout of the cloud at levels between 1.0287 and 1.0260. If bearish traders continue to assert their dominance and activity, they may further drive the decline, with intraday targets aligning with the support levels of the classic Pivot points and the breakout target of the H4 cloud. To change the current balance of power, bullish traders need to reclaim the weekly long-term trend at 1.0429 by consolidating above this level. Intraday bullish targets correspond to the resistance levels of the classic Pivot points. New updated Pivot level will be available when the market opens.
***
GBP/USD
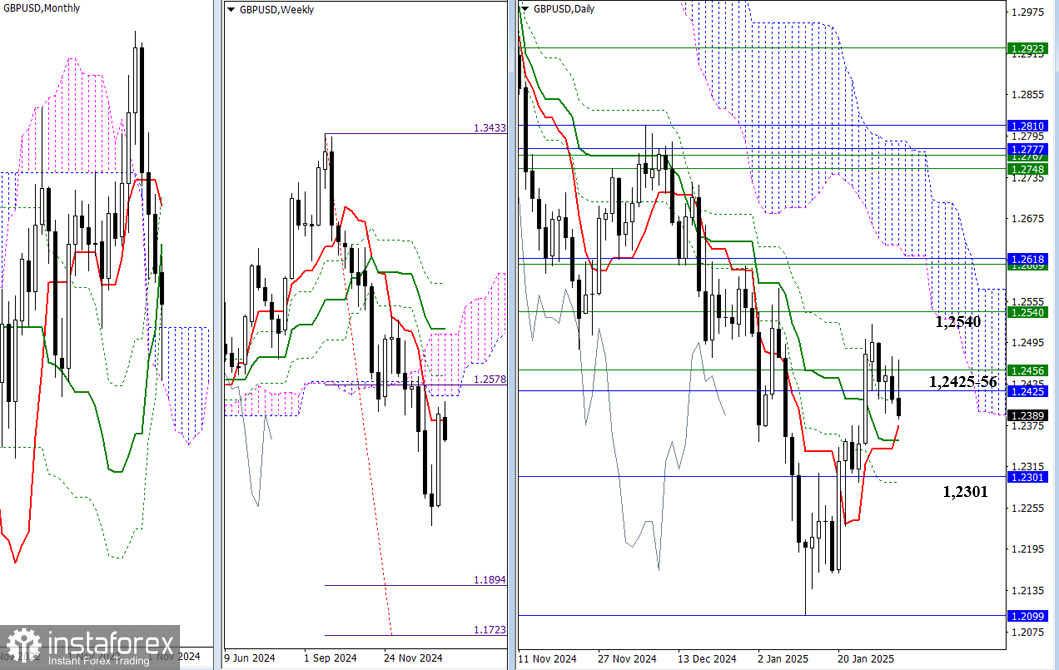
In January, the market tested the monthly cloud between 1.2099 and 1.2301, but ultimately closed well above it. Currently, the short-term weekly trend is at 1.2456, and the monthly level is at 1.2425, both of which are influencing market movements. If bullish traders want to build and strengthen their momentum, they will need to overcome the resistance at 1.2425–1.2456. This involves entering the weekly cloud at 1.2540 and focusing on testing resistances around the lower boundary of the daily cloud and the monthly medium-term trend, which is at 1.2618. On the other hand, if bearish traders maintain the initiative, their main objective will be to return to the monthly cloud at 1.2301. The daily Ichimoku cross, located between 1.2375 and 1.2352, will serve as nearby support along this path, with the goal of pushing down to the lower boundary at 1.2099 in an effort to restore the downtrend.
H4 – H1
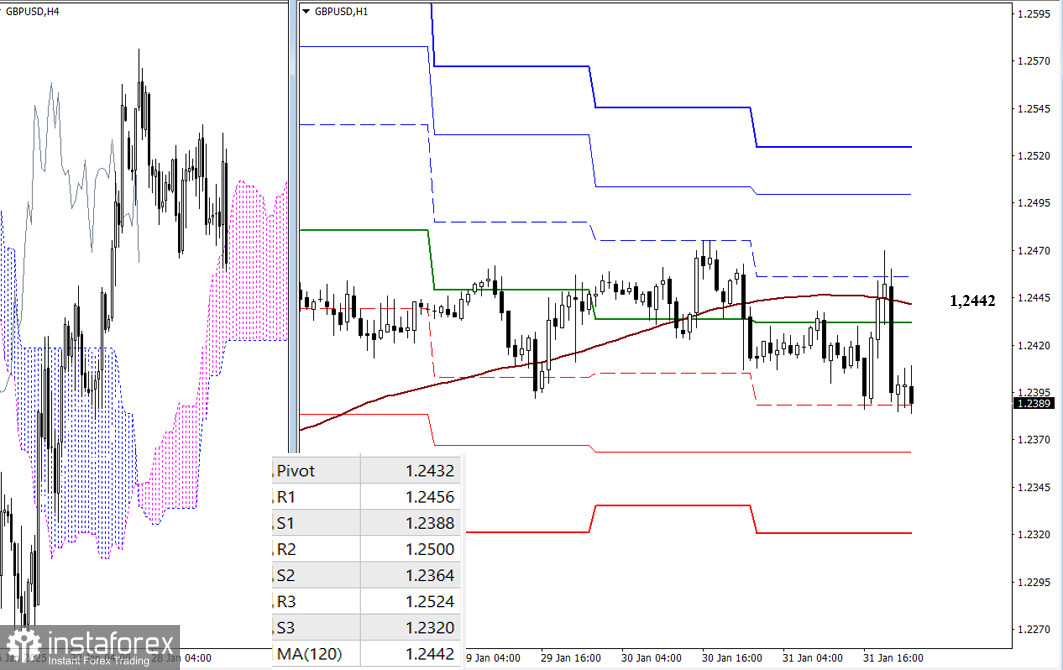
Bearish traders have taken control in the lower timeframes. If they can keep the market below the weekly long-term trend level at 1.2442, they will continue to push the decline and strengthen their positions. However, if bullish traders manage to regain the advantage and consolidate above the weekly long-term trend at 1.2442, flipping it to their favor, we can expect an increase in bullish sentiment. The intraday benchmarks consist of the support and resistance levels established by the classic Pivot points, which are updated daily.
***
Technical Analysis Components:
- Higher Timeframes: Ichimoku Kinko Hyo (9.26.52) and Fibonacci Kijun levels
- H1: Classic Pivot Points and 120-period Moving Average (weekly long-term trend)


