


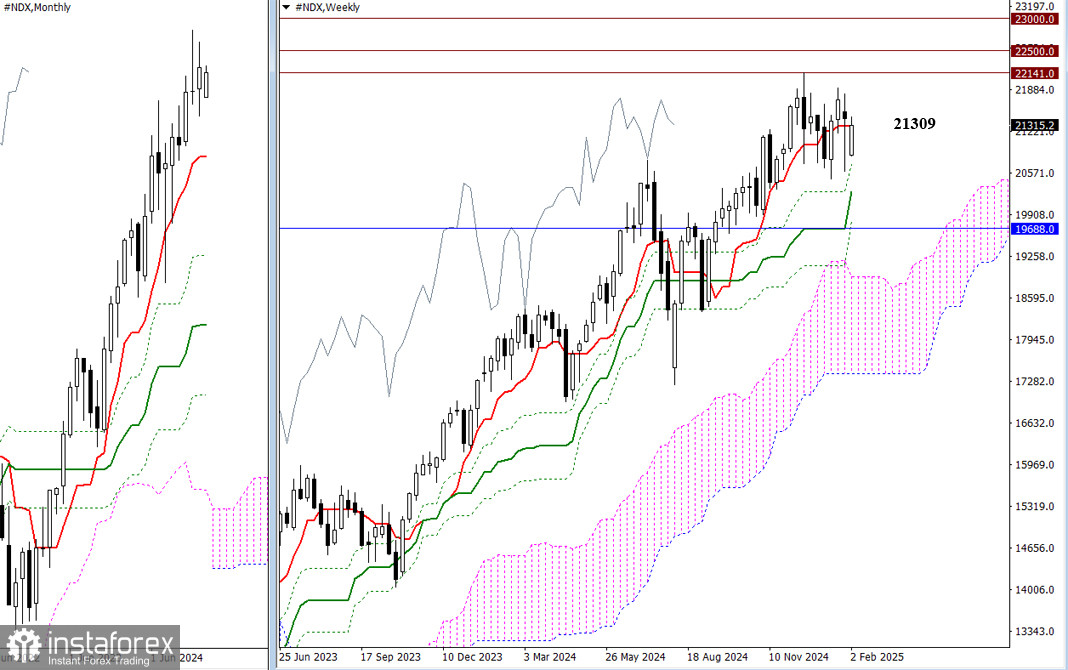
At the end of last year, the index reached a new all-time high of 22,141. Following that peak, the upward momentum stalled, leading to a correction and consolidation phase. Currently, the key focus is the weekly short-term trend level at 21,309. Even yesterday, despite a significant downward gap, prices managed to rebound back to the 21,309 area. Given the current conditions, we can identify the nearest benchmarks for potential market movement. If bullish activity continues, a breakout above the all-time high of 22,141 could pave the way for further gains, targeting the psychological levels of 22,500 and 23,000. On the other hand, if the consolidation phase ends with bearish momentum, the primary targets would involve breaking the Ichimoku weekly cross and a corrective decline towards the monthly short-term trend level at 19,688.
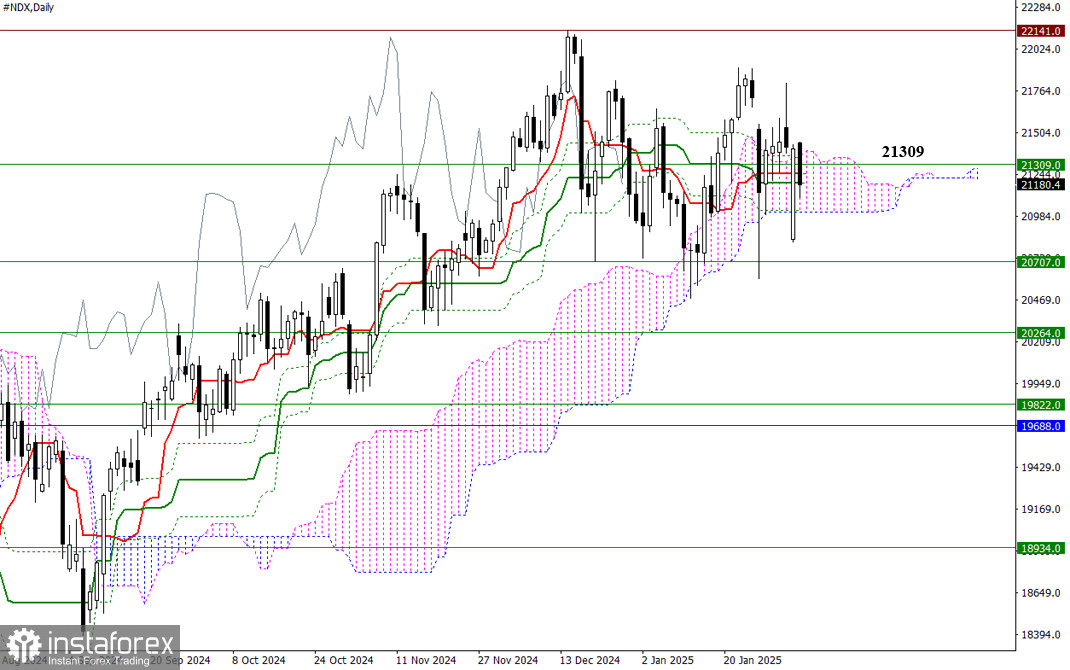
For two consecutive weeks, the market has opened with a significant downward gap, followed by rapid attempts to recover and close that gap. A clear struggle is occurring: one side is trying to push the index much lower, while the other side is working hard to maintain current levels. At present, the bulls have a clear path toward the all-time high of 22,141. The daily Ichimoku setup supports this scenario, featuring a daily cross and daily cloud, along with additional support from the weekly short-term trend at 21,309. If the market breaks below the daily cloud at 21,014, it would trigger a bearish target with further declines potentially reaching the monthly short-term trend at 19,688. Additional support along this trajectory may come from weekly levels at 20,707, 20,264, and 19,822.
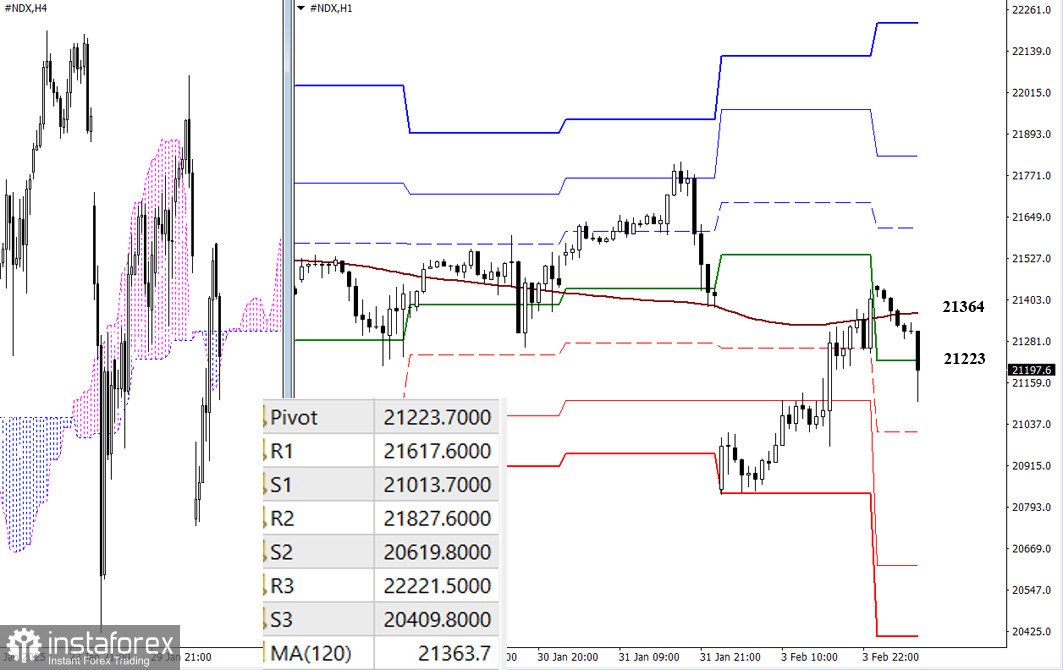
On lower timeframes, the bulls have managed to push the price back to the area of the weekly long-term trend, which is currently positioned at 21,364. The slope and position of this trend contribute to the prevailing uncertainty in the market. We may continue to see consolidation; however, if there are attempts to establish a directional move during the day, classic Pivot levels will serve as key reference points. For the bears, it will be crucial to break through support levels at 21,014, 20,620, and 20,410. Meanwhile, the bulls will be targeting resistance levels at 21,618, 21,828, and 22,222.
***
Technical Analysis Components:
- Higher Timeframes: Ichimoku Kinko Hyo (9.26.52) and Fibonacci Kijun levels
- H1: Classic Pivot Points and 120-period Moving Average (weekly long-term trend)


