


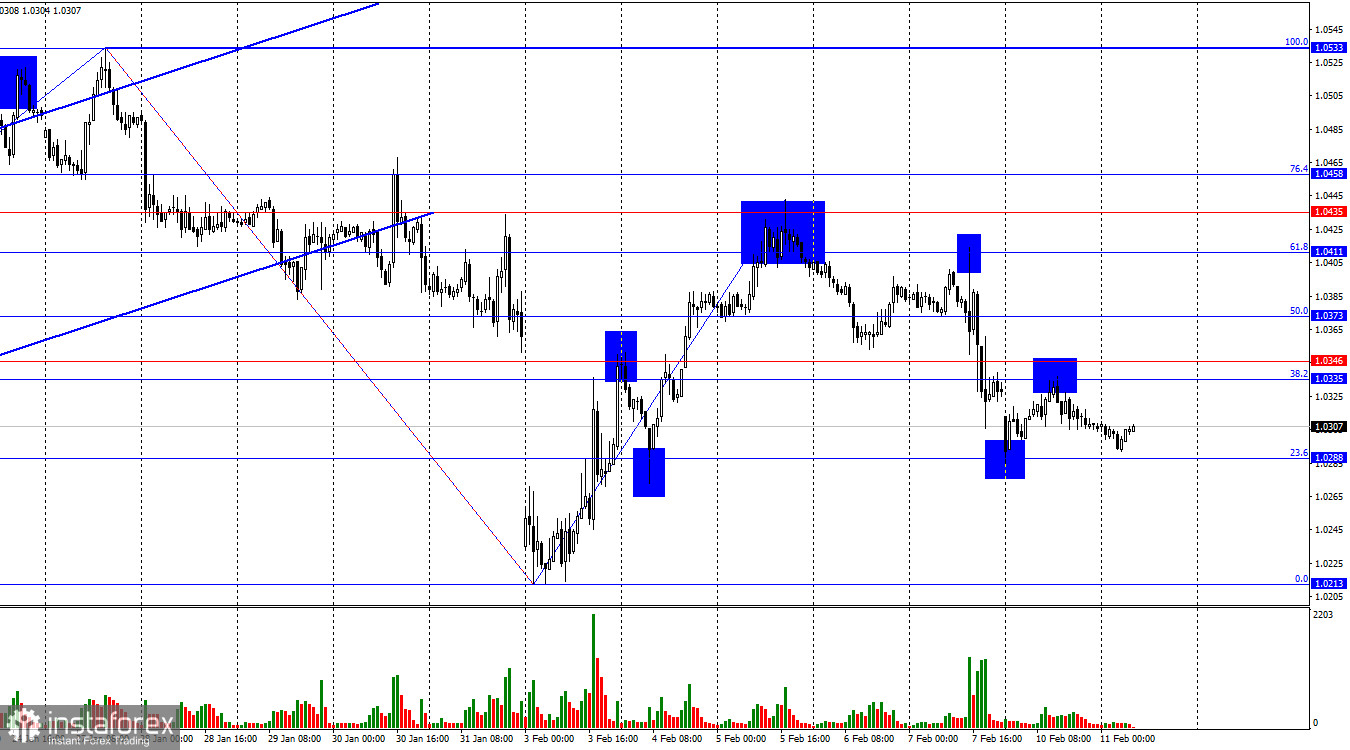
On the hourly chart, the wave structure has become unclear. The last completed downward wave broke the previous low. The last completed upward wave failed to break the previous high.
This suggests that the trend has shifted to bearish or that the pair is moving in a complex horizontal consolidation pattern. The inconsistency in wave sizes raises doubts about a clear trend direction.
Although Monday lacked economic data, debates over Trump's trade war strategy remain active. What is Trump trying to achieve with tariffs? The U.S. president aims to bring manufacturing back to the U.S. and reduce the trade deficit. Can tariffs accomplish this goal? China, Mexico, and Canada heavily depend on U.S. exports. Tariffs on these countries could significantly harm their GDP. However, U.S. inflation is also rising, which may force the Fed to keep interest rates high longer—or even raise them. For the dollar, this situation is more likely a good thing than a bad thing, but at the same time, I do not believe that the American economy will grow through trade wars. Mexico and Canada accepted Trump's initial terms, but they may reject his new ultimatums. China hasn't even complied with the first set of U.S. demands.
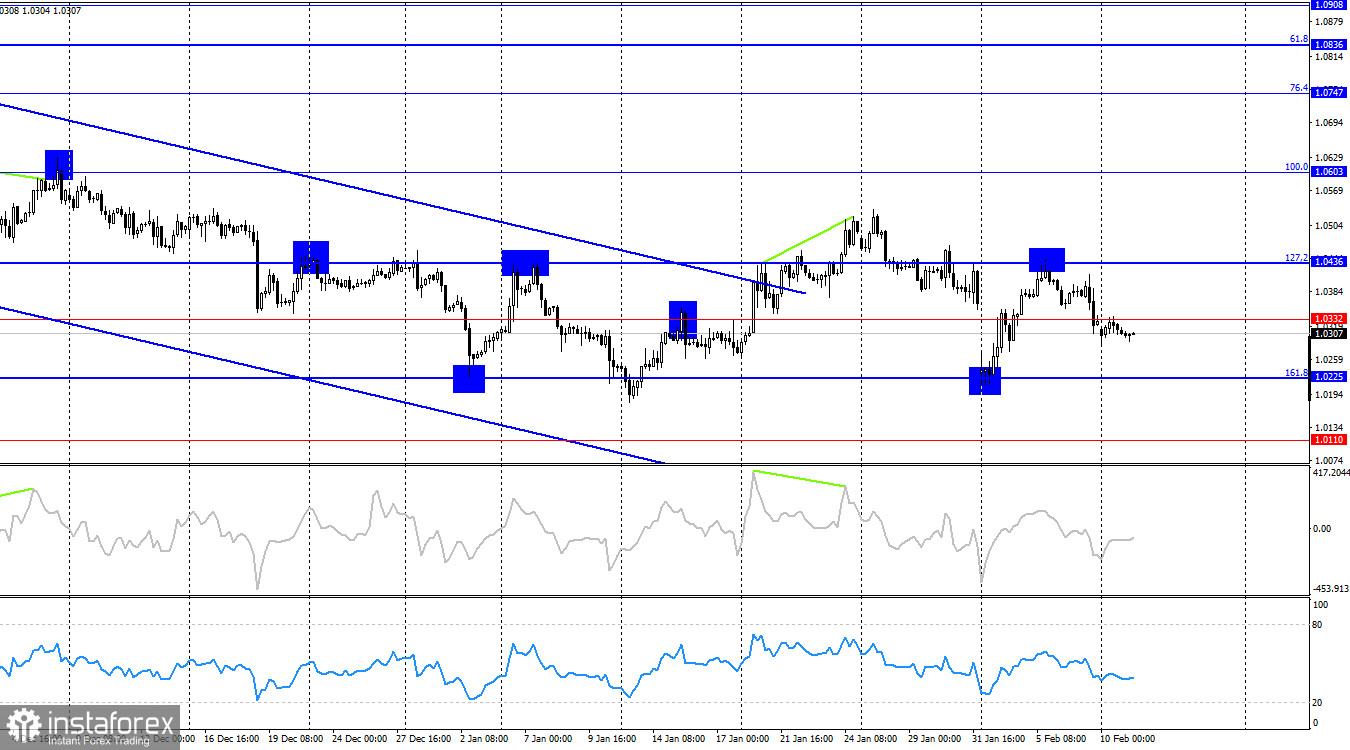
On the H4 Chart, the EUR/USD pair rejected the 127.2% Fibonacci retracement level at 1.0436, leading to a bearish reversal in favor of the U.S. dollar. The pair now has a realistic chance of declining further toward the 161.8% Fibonacci level at 1.0225. For bulls to regain control, they will need a strong fundamental catalyst to break through 1.0436. No divergence signals are currently observed on any indicators.
Commitments of Traders (COT) Report Analysis
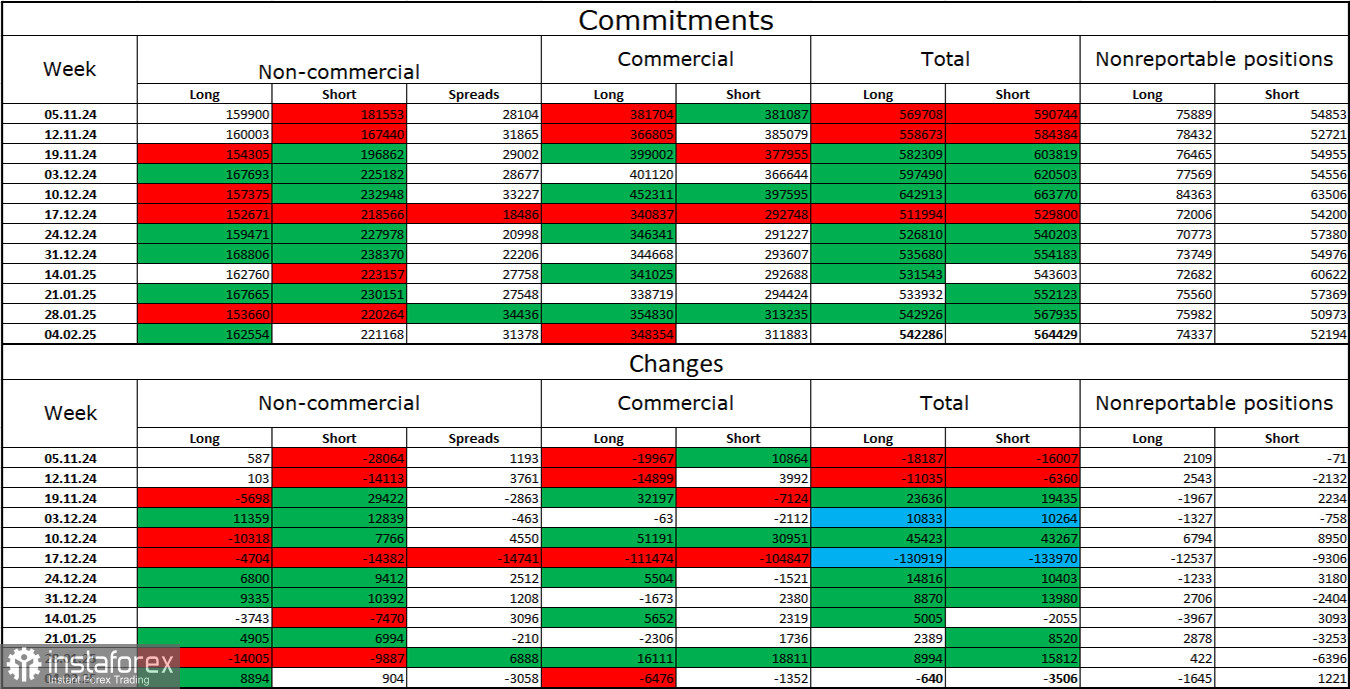
In the latest reporting week, institutional traders opened 8,894 long positions and 904 short positions. The total number of long positions concentrated in the hands of speculators now stands at 162,000, and short positions at 221,000.
For 20 consecutive weeks, institutional traders have been selling the euro—a clear bearish trend. While bulls occasionally dominate for brief periods, this is the exception rather than the rule. The primary bearish driver—the expectation of Fed policy easing—has already been priced in. There are no strong reasons to sell the dollar further. Future catalysts may emerge, but for now, the U.S. dollar is more likely to continue strengthening. Technical analysis also supports a continuation of the long-term bearish trend. I expect EUR/USD to continue declining in the medium term.
Key Economic Events for the U.S. and the Eurozone (February 11)
- United States – Fed Chair Jerome Powell's Testimony (15:00 UTC).
The economic calendar for February 11 contains only one major event. Powell's speech is expected to have a moderate market impact, likely influencing sentiment in the second half of the trading day.
Trading Recommendations for EUR/USD
Selling the pair was a valid strategy after a rejection from 1.0411 on the hourly chart, with a target of 1.0335 – 1.0346. This target was reached with a strong margin.
On Monday, selling was also valid after rejection from 1.0335 – 1.0346, targeting 1.0288 and 1.0213. The first target (1.0288) has been reached. Buying could be considered near 1.0288, but the trend has turned bearish again.
Fibonacci levels are plotted as follows:
- 1H Chart: 1.0533 – 1.0213.
- 4H Chart: 1.0603 – 1.1214.


