


EUR/USD
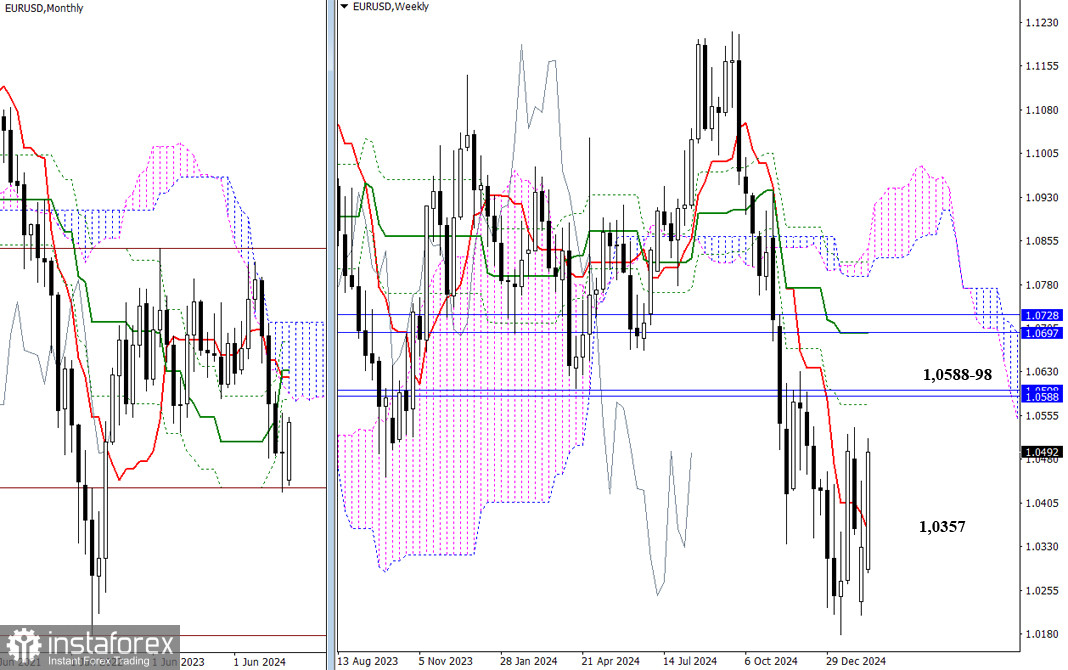
The bulls have managed to recover much of their previous losses, closing above the short-term weekly trend at 1.0357. If this bullish momentum continues, the pair could further advance in a weekly corrective rise toward the next resistance level at the Ichimoku weekly cross, which is at 1.0574. This level is further supported by two monthly resistance levels, 1.0588 and 1.0598, which strengthen the weekly barrier.
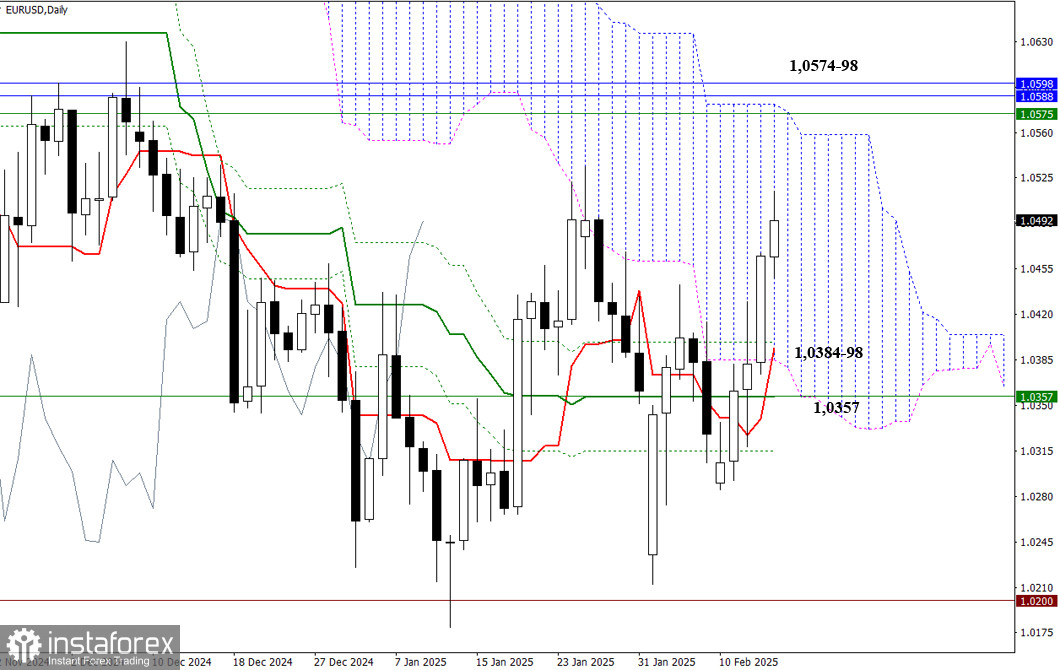
In the daily timeframe, buyers have entered the Ichimoku cloud and are making progress toward its upper boundary at 1.0581. This boundary is reinforced by several higher timeframe levels. The range of 1.0574 to 1.0598 now serves as the nearest target for upward movement. If the situation shifts in favor of the bears, they will look to return to support levels. The nearest support levels currently stand between 1.0384 and 1.0398, with an additional level at 1.0357.
***
GBP/USD
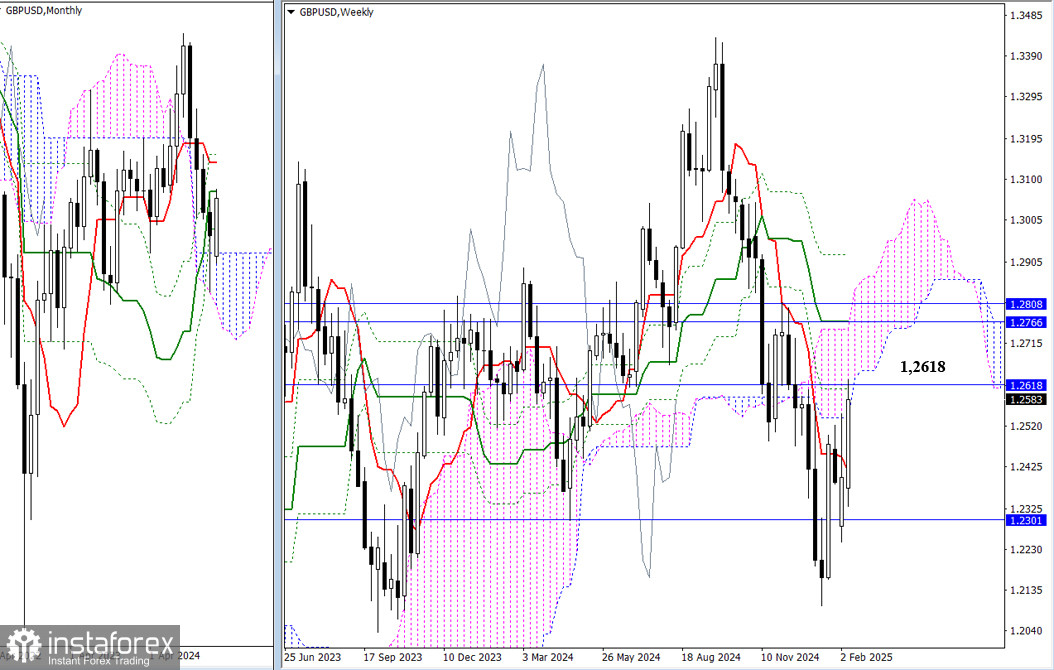
Last week, the bulls successfully pushed the pair back into the Ichimoku weekly cloud, reaching the monthly medium-term trend at 1.2618. If buyers can overcome this resistance, they will be able to advance toward the upper boundary of the weekly Ichimoku cloud, currently reinforced by multiple resistances between 1.2766 and 1.2808 (which includes the weekly medium-term trend and monthly Ichimoku cross levels). However, in case of a rebound from these resistance levels, the pair will fall to the support at the weekly short-term trend (1.2413) and the upper boundary of the monthly Ichimoku cloud (1.2301).
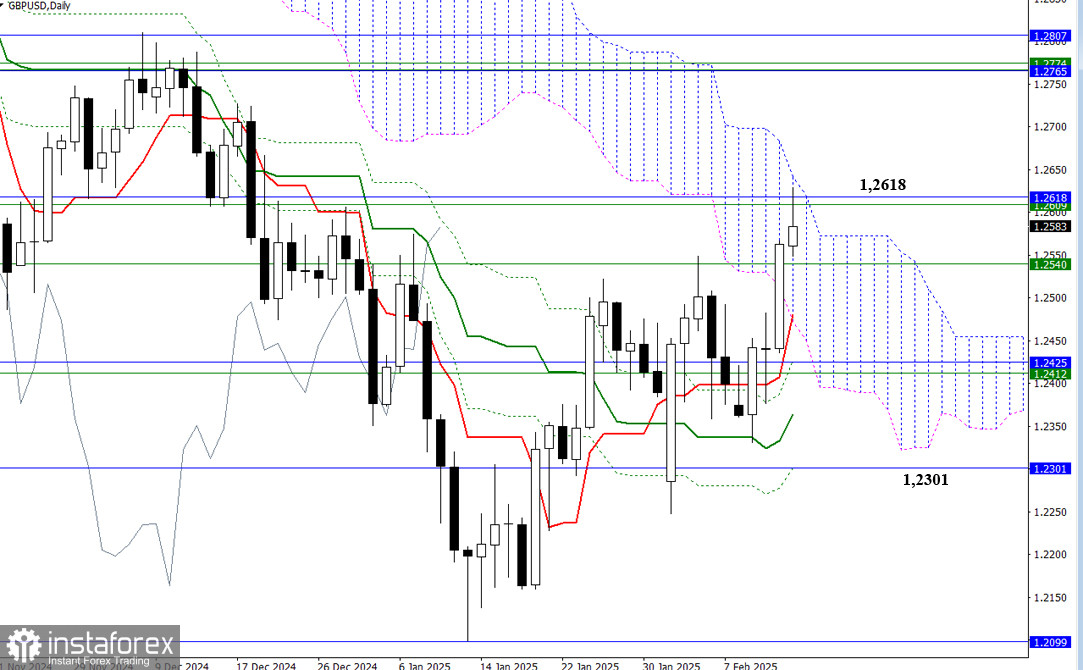
The daily timeframe offers a clearer perspective of the ongoing price action. A confirmed breakout above the monthly medium-term trend (1.2618) would indicate an exit from the Ichimoku cloud into a bullish zone, setting an uptrend breakout target. To achieve this target, the price must successfully surpass the resistance area at 1.2766 – 1.2808. Conversely, a rebound at the 1.2618 resistance level would likely push the pair back toward support at the daily Ichimoku cross (ranging from 1.2480 - 1.2427 - 1.2364 - 1.2301) and the higher timeframe levels mentioned earlier.
***
Technical Analysis Components:
Higher Timeframes: Ichimoku Kinko Hyo (9.26.52) and Fibonacci Kijun levels
H1: Classic Pivot Points and 120-period Moving Average (weekly long-term trend)


