


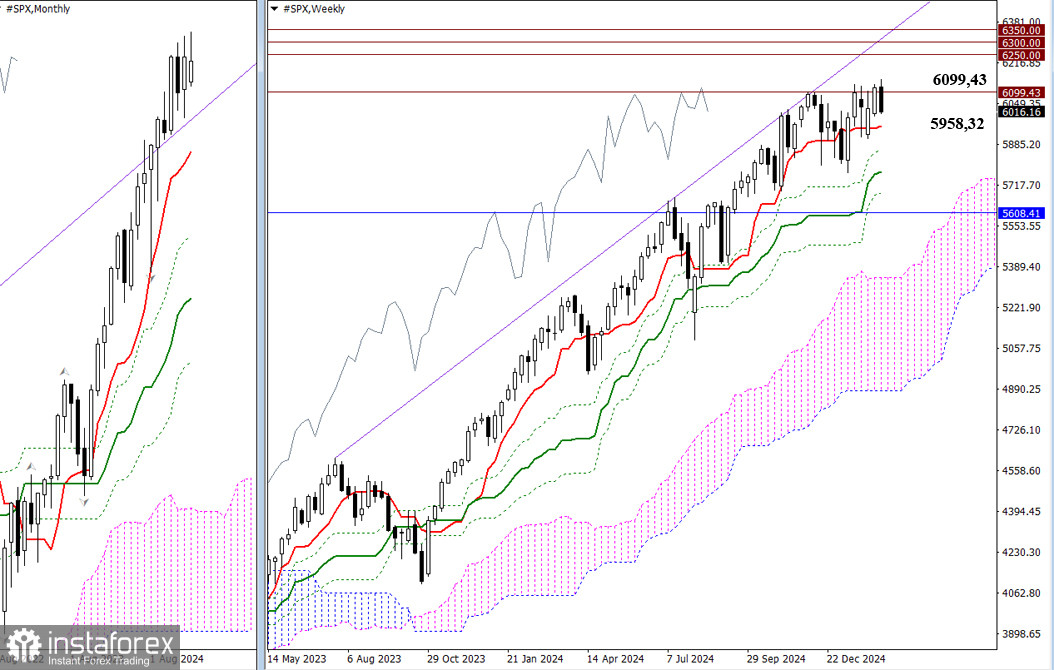
After a corrective decline at the end of last year, bullish players returned and updated the 2024 high (6099.43), but they failed to sustain further growth. As a result, we observe weekly consolidation within the boundaries of the short-term weekly trend (5958.32) and the 2024 maximum extreme (6099.43). The market must break out of these designated boundaries for the situation to change.
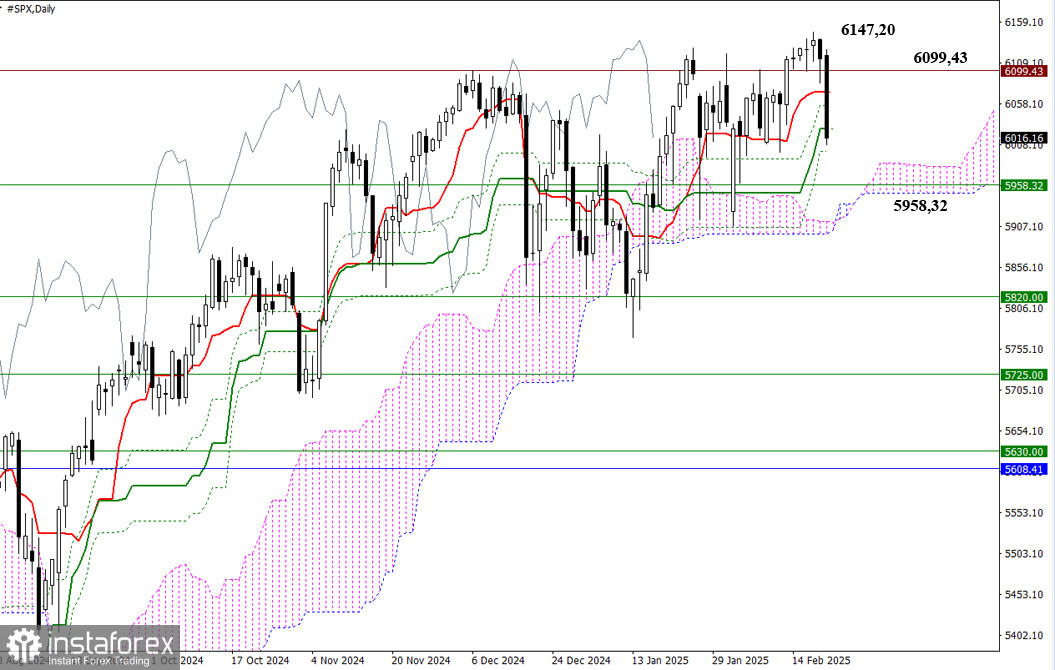
On the daily timeframe, bullish players showed weakness and a lack of momentum despite achieving a new all-time high (6147.20). Their opponents took advantage of this, delivering a notable decline on Friday, closing the week below the medium-term daily trend (6027.68). Due to bearish activity, the market is now at risk of eliminating the daily Ichimoku golden cross, the final level of which is currently positioned at 5999.47. In addition to this objective, bears aim to consolidate below the short-term weekly trend (5958.32) and break through the daily Ichimoku cloud.
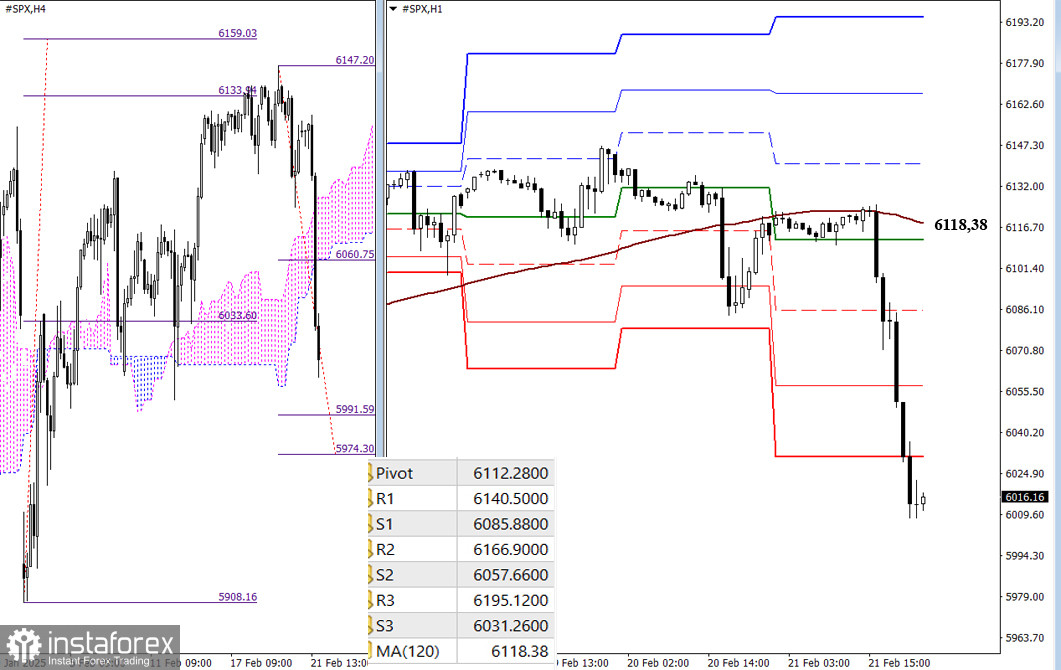
On lower timeframes, bearish players, after consolidating below the long-term weekly trend (6118.38), managed to develop a deep and effective decline. When trading reopens, new values for classic Pivot levels will be introduced, serving as key intraday reference points. Bears will focus on support levels of classic Pivot points while also targeting a downside breakout of the H4 Ichimoku cloud (5991.59 – 5974.30).
In contrast, bullish players will focus on resistance levels of classic pivot points in the event of an upward movement. To shift the current balance of power, bulls must test and overcome key levels on lower timeframes—specifically, the central Pivot level of the day and the long-term weekly trend (6118.38).
***
Technical Analysis Components:
- Higher Timeframes: Ichimoku Kinko Hyo (9.26.52) and Fibonacci Kijun levels
- H1: Classic Pivot Points and 120-period Moving Average (weekly long-term trend)


