


Over the past few weeks, demand for the euro has been increasing, but at such a slow pace that wave C has yet to surpass the peak of wave A. As a result, wave 2 remains incomplete and lacks a finalized structure. However, I have previously warned that the formation of a corrective structure could take a considerable amount of time, and wave 2 might develop into a five-wave or even more complex formation.
The recent fundamental backdrop still does not provide much support for euro buyers. Economic data from the Eurozone remains unimpressive, while the ECB maintains its dovish stance. In contrast, the U.S. has stronger economic reports, and the Federal Reserve's stance is much less dovish. Based on these conditions, the chances of the EUR/USD pair resuming its decline appear much higher.
However, the upcoming week has a relatively weak fundamental backdrop—at least in terms of scheduled and known events. There will be few reports from the Eurozone, and most of them are secondary indicators that are unlikely to significantly boost demand for the euro. As a result, the EUR/USD pair is likely to struggle with completing wave 2 once again.
Key Reports to Watch Next Week
Among the notable releases next week, I would highlight:
- The final Eurozone Consumer Price Index (CPI) for January
- Germany's final Q4 GDP reading
- A series of reports from Germany on Friday, including the unemployment rate and inflation data
The Friday reports will be the most interesting, but they focus on a single country, even though Germany has the strongest economy in the EU. I expect the market to make further attempts to increase demand for the euro, but I am not convinced these attempts will be successful.
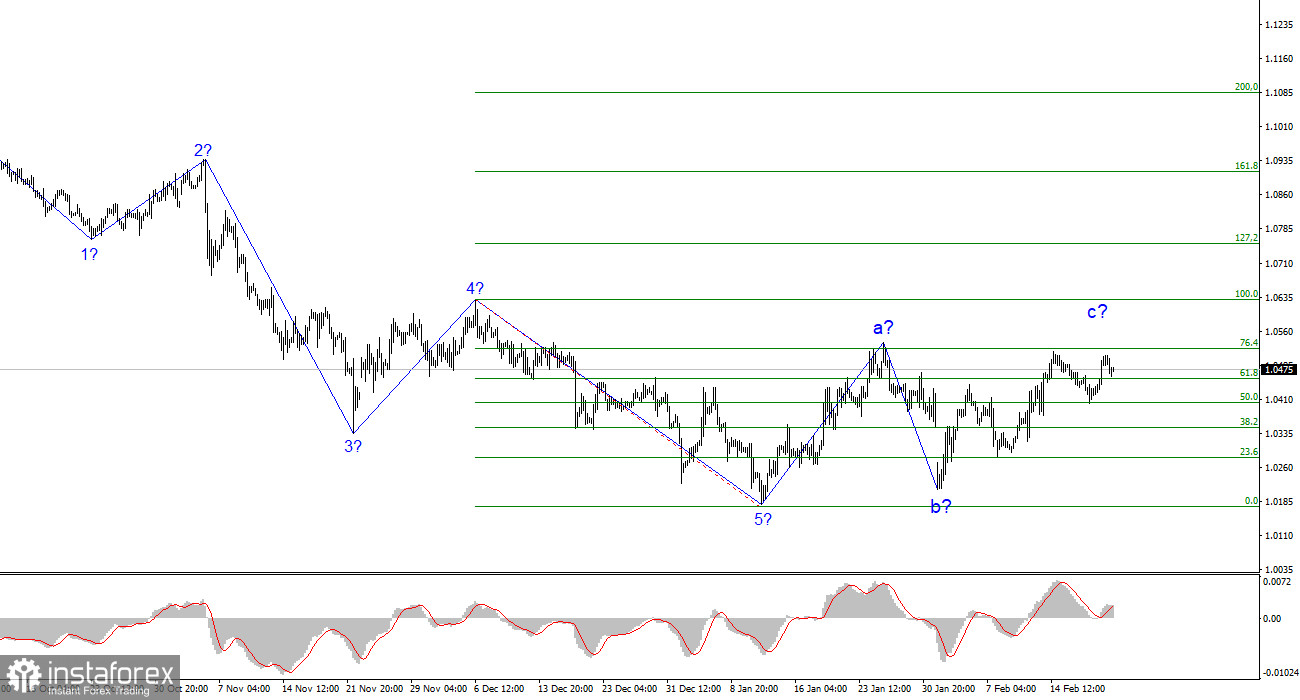
Wave Analysis for EUR/USD
Based on the conducted wave analysis, the EUR/USD pair continues to form a downward trend segment. The first wave of this segment appears strong and completed, meaning we should now expect a three-wave or more complex corrective structure, where new short-selling opportunities can be sought—preferably at the highest points of this structure.
I expect to see a convincing wave C within wave 2, but this wave may take a shortened form. An alternative scenario would involve a five-wave structure within wave 2.
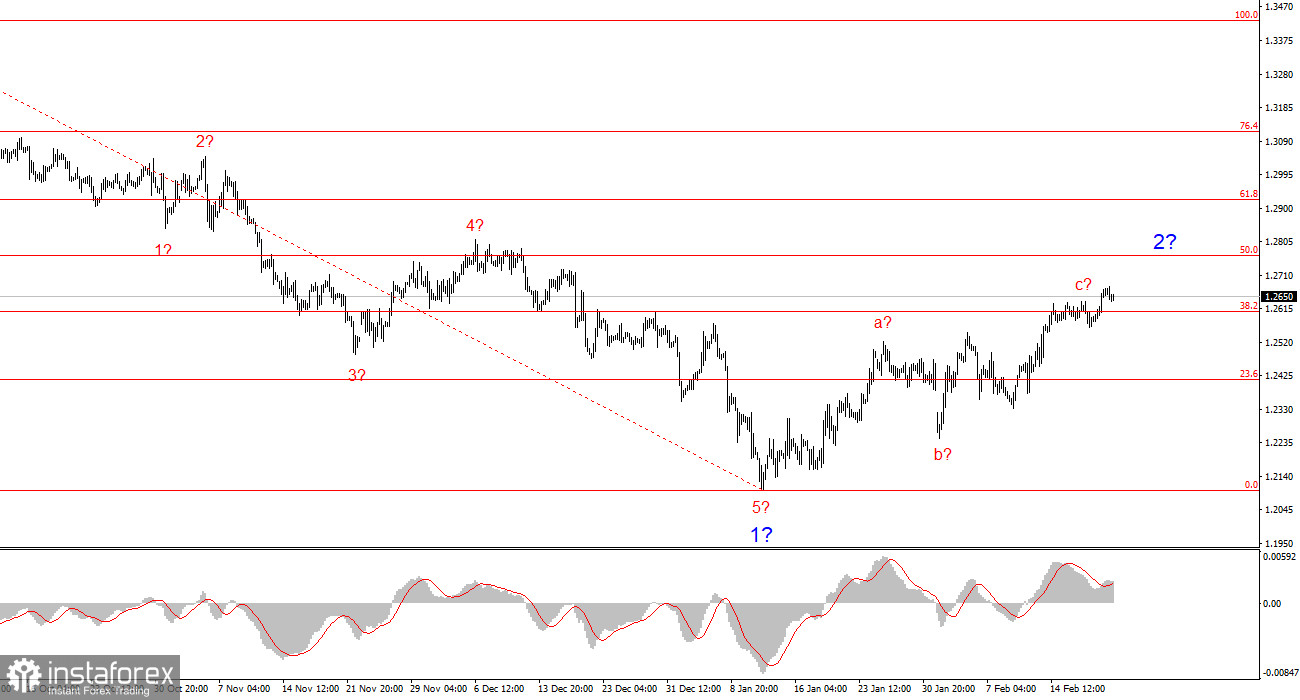
Wave Analysis for GBP/USD
The GBP/USD wave structure indicates that the downtrend formation is ongoing, and its first wave has already completed. Now, we should wait for the development of a clear corrective pattern, after which new short-selling opportunities can be considered.
The minimum targets for this correction are around the 1.26 level (already reached), while a more optimistic outlook suggests a potential move toward 1.28. Overall, even the current price levels could be considered for selling, as wave C is nearing completion. However, it would be even more prudent to wait for confirmation signals, which each trader may interpret differently.
Key Principles of My Analysis
- Wave structures should be simple and clear. Complex structures are difficult to trade and frequently change.
- If you are uncertain about market conditions, it is better to stay out of the market.
- There is never 100% certainty in price movement direction—always use Stop Loss orders.
- Wave analysis can be combined with other methods of market analysis and trading strategies.


