


Trend Analysis (Figure 1)
On Tuesday, the market may begin an upward movement from the 1.0467 level (Monday's closing price), aiming to test the 1.0528 upper fractal level (red dotted line). If this level is tested, the price may then reverse downward toward the 1.0496 historical support level (blue dotted line).
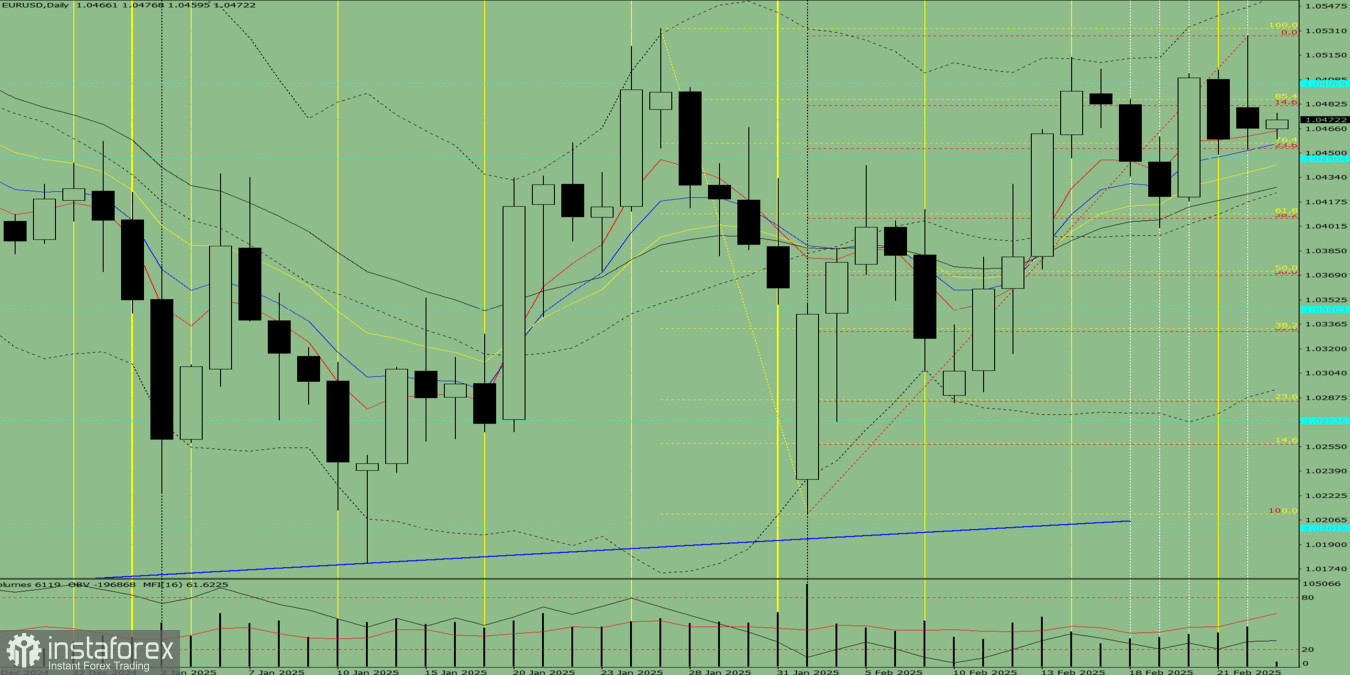
Figure 1: Daily Chart
Comprehensive Analysis
- Indicator analysis: bullish
- Volume analysis: bullish
- Candlestick analysis: bearish
- Trend analysis: bullish
- Bollinger Bands: bullish
- Weekly chart outlook: bullish
General Conclusion:
The overall trend suggests a bullish movement.
Alternative Scenario:
The price may rise from 1.0467, aiming to test the 1.0533 upper fractal level (yellow dotted line). If tested, the pair may then decline toward 1.0496, which serves as a key historical support level (blue dotted line).


