


On the daily chart, the price is nearing a significant resistance level, which is characterized by the MACD line, the price channel line, and the resistance at 1.4464.
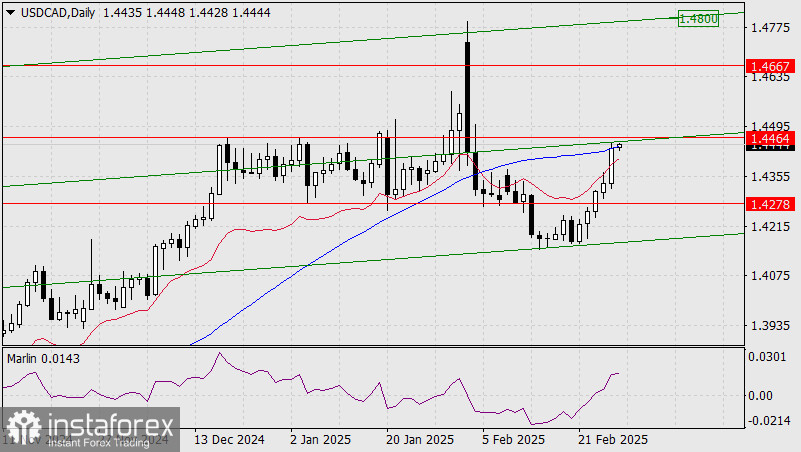
If the price breaks through this level, it could pave the way for growth toward 1.4667 and then 1.4800. However, the Marlin oscillator's signal line has shown a slowdown in its upward movement, indicating a potential pullback from the resistance.
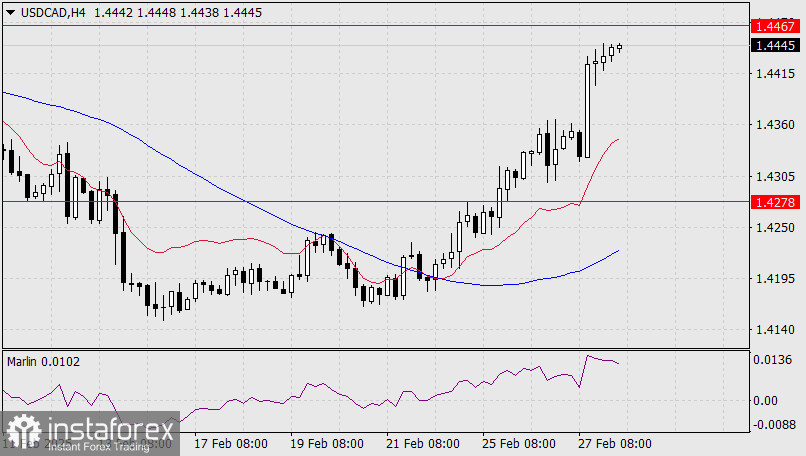
On the H4 chart, the Marlin oscillator is not showing an immediate inclination to decline. There is a strong likelihood that the price will surpass the 1.4464 level and consolidate above it, especially in preparation for key events occurring next week.


