


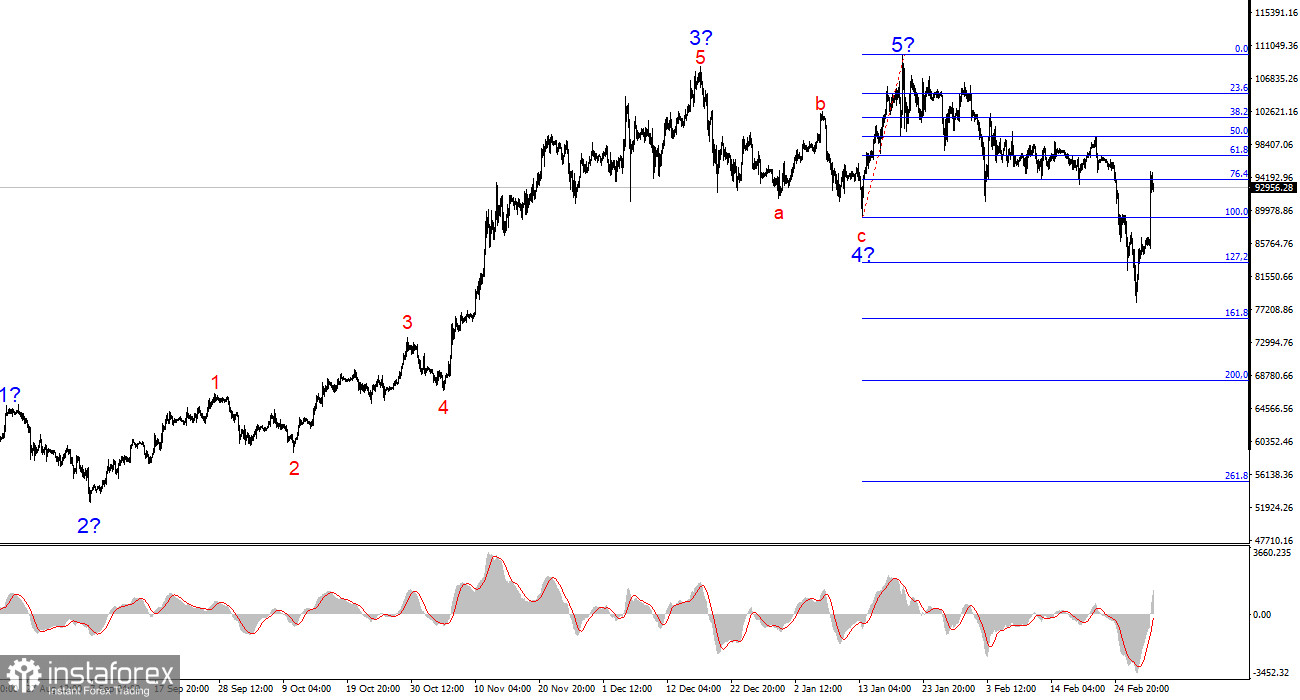
The wave structure on the 4-hour chart for BTC/USD appears clear and well-defined. Following a prolonged and complex corrective pattern (a-b-c-d-e) from March 14 to August 5, a new impulse wave began to form, adopting a five-wave structure. Given the size of the first wave, the fifth wave might have been truncated, which is why I did not and do not expect Bitcoin to rise above $110,000–$115,000 in the coming months.
Additionally, wave 4 took on a three-wave structure, confirming the accuracy of the current wave count. Bitcoin's growth was previously fueled by consistent news of institutional investments, including government allocations and pension fund purchases. However, Trump's policies forced investors to exit the market, and no trend can remain permanently bullish. The wave that began on January 20 does not resemble a typical first impulse wave, indicating that we are dealing with a complex corrective structure that could persist for months.
BTC/USD surged $8,000 in a single day, and it is not difficult to identify the reason behind this sharp rally. Donald Trump announced the creation of a U.S. crypto reserve, which would include Bitcoin, Ethereum, Solana, and XRP. However, the market was not particularly concerned with which additional cryptocurrencies would be included in a reserve that may or may not be established someday. Instead, the entire market rallied on the news. Trump further declared his intention to make America the "global capital of cryptocurrency," igniting a new wave of optimism among traders and investors.
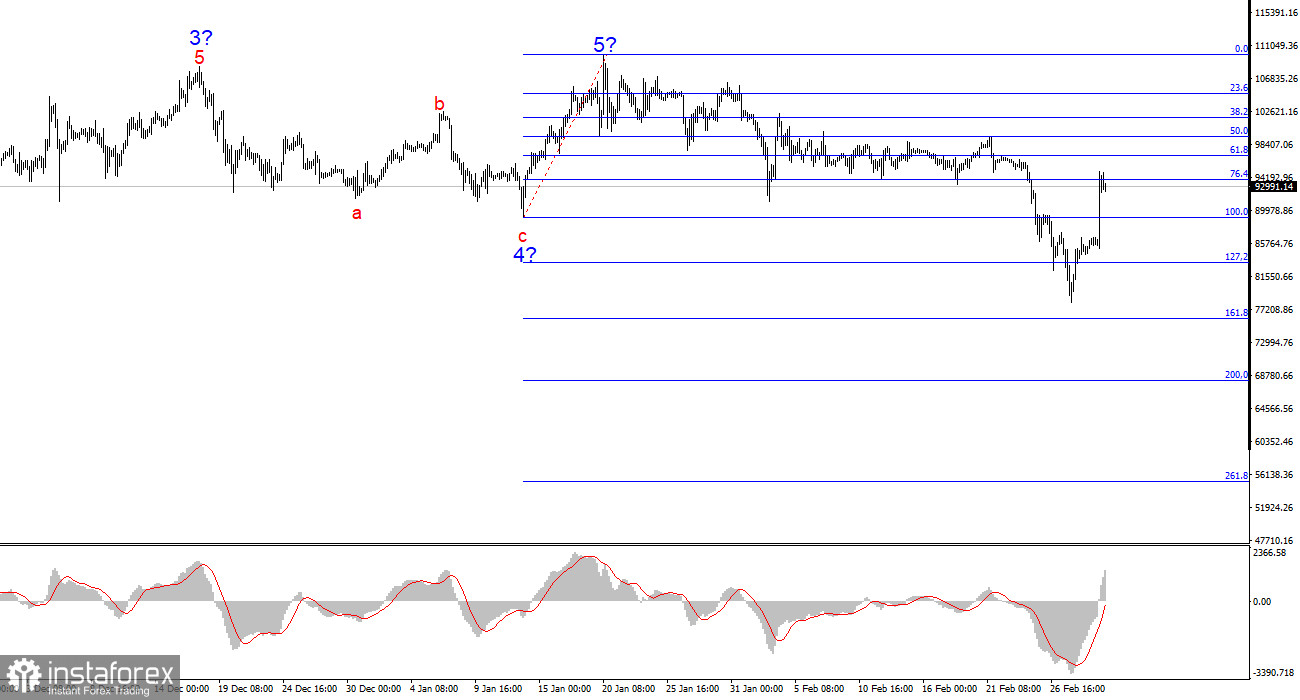
However, the current wave structure still indicates the formation of a bearish corrective phase. This correction is likely to be complex, meaning that the decline to $77,000 was not the final drop. As I have previously mentioned, Trump, as a businessman, is unlikely to buy Bitcoin at $90,000–$100,000. The crypto market is susceptible to manipulation, and pushing Bitcoin down by tens of thousands of dollars is not an impossible task.
Thus, a further decline is inevitable due to wave structure constraints, and Trump may also attempt to significantly lower Bitcoin's price to facilitate the creation of the U.S. reserve. My expectations remain unchanged.
General Conclusions
Based on the BTC/USD analysis, I conclude that Bitcoin's current rally is over. A complex correction appears inevitable. For this reason, I have not recommended buying Bitcoin before, and I certainly do not recommend it now. A drop below the low of wave 4 would confirm that Bitcoin is entering a bearish trend phase, likely a corrective one. Given this, the best strategy is to look for short-selling opportunities on lower timeframes. Bitcoin could decline to $76,000 (161.8% Fibonacci) and potentially to $68,000 (200.0% Fibonacci) within the coming weeks.
On the higher wave scale, a five-wave bullish structure is clearly visible. However, the market has now begun forming a bearish correction, which could either be a corrective phase or the start of a full-fledged downtrend.
Key Principles of My Analysis:
- Wave structures should be simple and clear. Complex formations are difficult to trade and often require adjustments.
- If you are uncertain about the market direction, it's better to stay out.
- There is never 100% certainty in market movement. Always use Stop-Loss orders to protect your capital.
- Wave analysis can be combined with other forms of analysis and trading strategies.


