


Trend Analysis
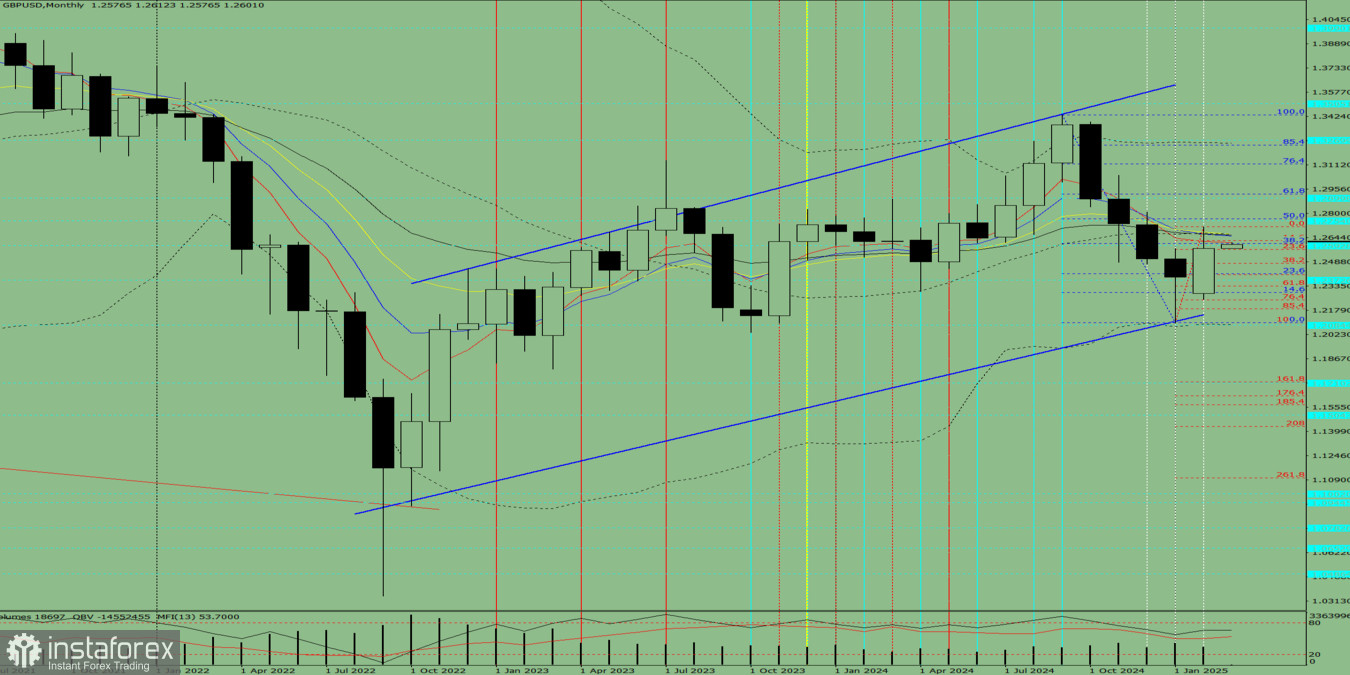
In March, starting from 1.2576 (February's closing price), the price may continue moving upward toward 1.2767 – the 50% retracement level (blue dashed line). If this level is tested, further upward movement toward 1.2920 – the 61.8% retracement level (blue dashed line) is possible.
Technical Indicator Analysis
- Trend Analysis: Up
- Fibonacci Levels: Up
- Volume Analysis: Up
- Candlestick Analysis: Up
- Bollinger Bands: Up
Conclusion Based on Comprehensive Analysis
A bullish trend is likely.
Projected Monthly Candle Formation
The GBP/USD price is expected to follow a strong upward trend, forming a white monthly candle with no lower shadow in the first week (indicating a bullish start) and a potential upper shadow in the last week (indicating a correction toward the end of the month).
Alternative Scenario
If the price, starting from 1.2576 (February's closing level), begins an upward movement, it may reach 1.2767 (50% retracement level, blue dashed line). At this level, a downward reversal could occur, targeting 1.2624 (14.6% retracement level, red dashed line).


