


EUR/USD 5-Minute Analysis

The EUR/USD currency pair experienced a significant rally on Monday. Over the weekend, we cautioned that volatility could be high on Monday, with the market potentially reacting to events from Friday at the White House. This anticipation proved accurate. As soon as trading opened, the U.S. dollar began to decline, reflecting what appears to be a protest in the foreign exchange market against Donald Trump. In the past, the market would respond to tariffs, sanctions, threats, and insults from the U.S. president by buying the dollar. However, the trend has reversed, with traders offloading the American currency despite the fact that nothing substantial occurred on Friday—only a verbal exchange between the U.S. and Ukrainian presidents.
We believe that Monday's macroeconomic data was not the primary driver behind the pair's rally. While the EU inflation report did come in higher than expected, and the U.S. ISM manufacturing PMI fell short of forecasts, these deviations were minor and, as mentioned, the dollar's decline had already begun overnight. Inflation is unlikely to influence the European Central Bank's decision on Thursday, and the ISM index remains above 50.0. Therefore, these reports could not account for a 120-pip drop in the dollar. Additionally, the euro continues to move within a range on the daily timeframe. Given this context, we wouldn't be surprised if the pair starts to decline again today.
On the 5-minute chart, two trading signals formed yesterday, but they weren't ideal for trading. First, the price bounced off the Senkou Span B line but only moved 20 pips downward. Then, a strong rally began, with the price easily breaking through the Ichimoku indicator lines and surpassing the 1.0461 level. Long positions could only be considered above 1.0461, but they carried significant risk, as by that point, the euro had already increased by 95 pips.
COT Report
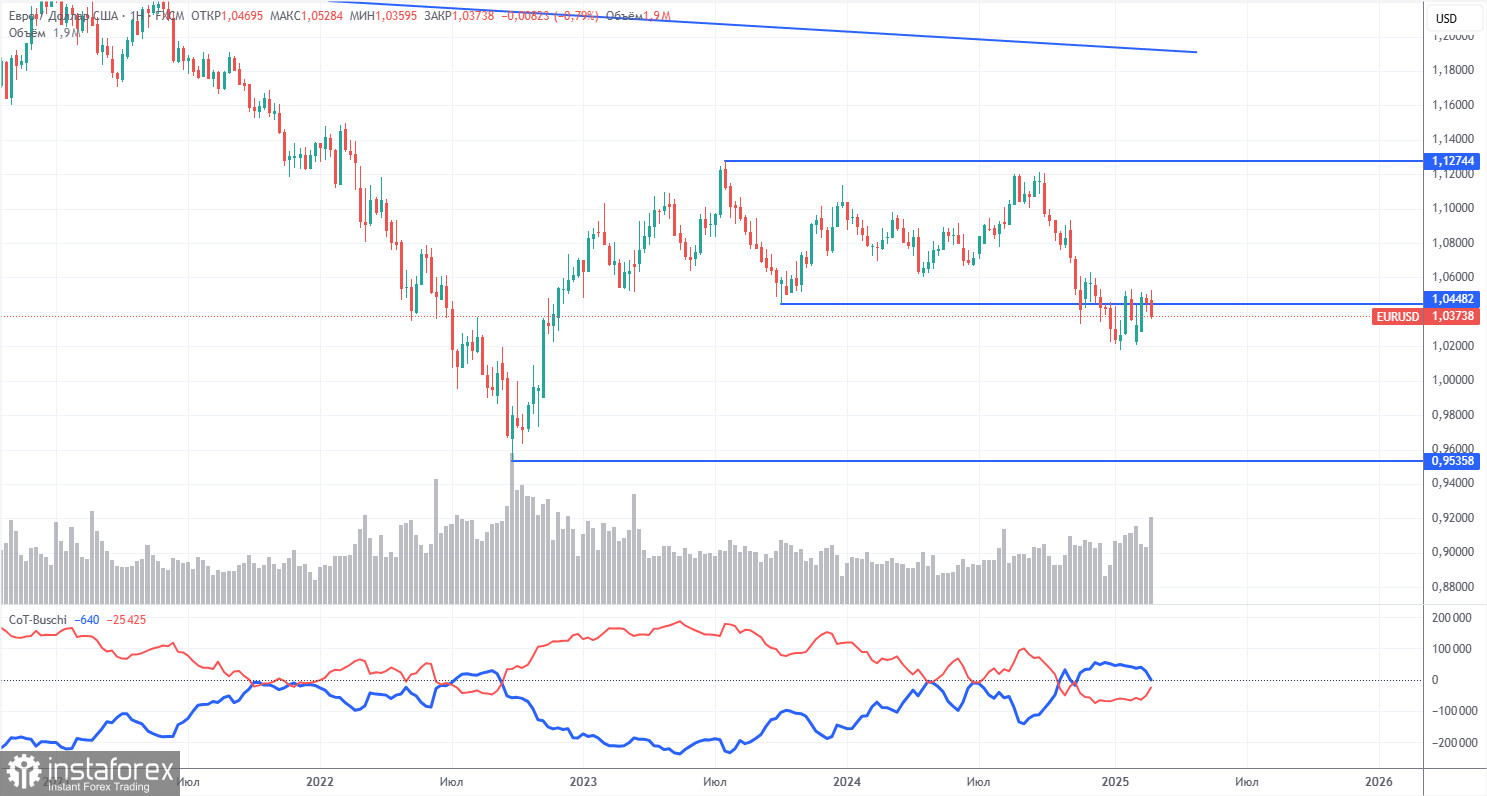
The latest Commitment of Traders (COT) report is dated February 25. The illustration above clearly shows that non-commercial traders have maintained a bullish net position for an extended period; however, bears have now taken the lead. Three months ago, professional traders significantly increased their short positions, causing the net position to turn negative for the first time in a while. This indicates that the euro is currently being sold more often than it is being bought, and bearish sentiment continues to dominate the market.
There are still no fundamental factors supporting a strengthening of the euro. The recent upward movement observed on the weekly timeframe is minimal and appears to be merely a technical correction. The long-term downward trend, which has persisted for 16 years, remains intact, even if the pair experiences correction for several more weeks or months.
At present, the red and blue lines have crossed and reversed their positions relative to each other, signaling a bearish trend in the market. During the last reporting week, long positions among the "non-commercial" group increased by 12,400, while short positions decreased by 13,600. Consequently, the net position rose by 26,000 contracts; however, this change has not yet influenced the overall market sentiment.
EUR/USD 1-Hour Analysis
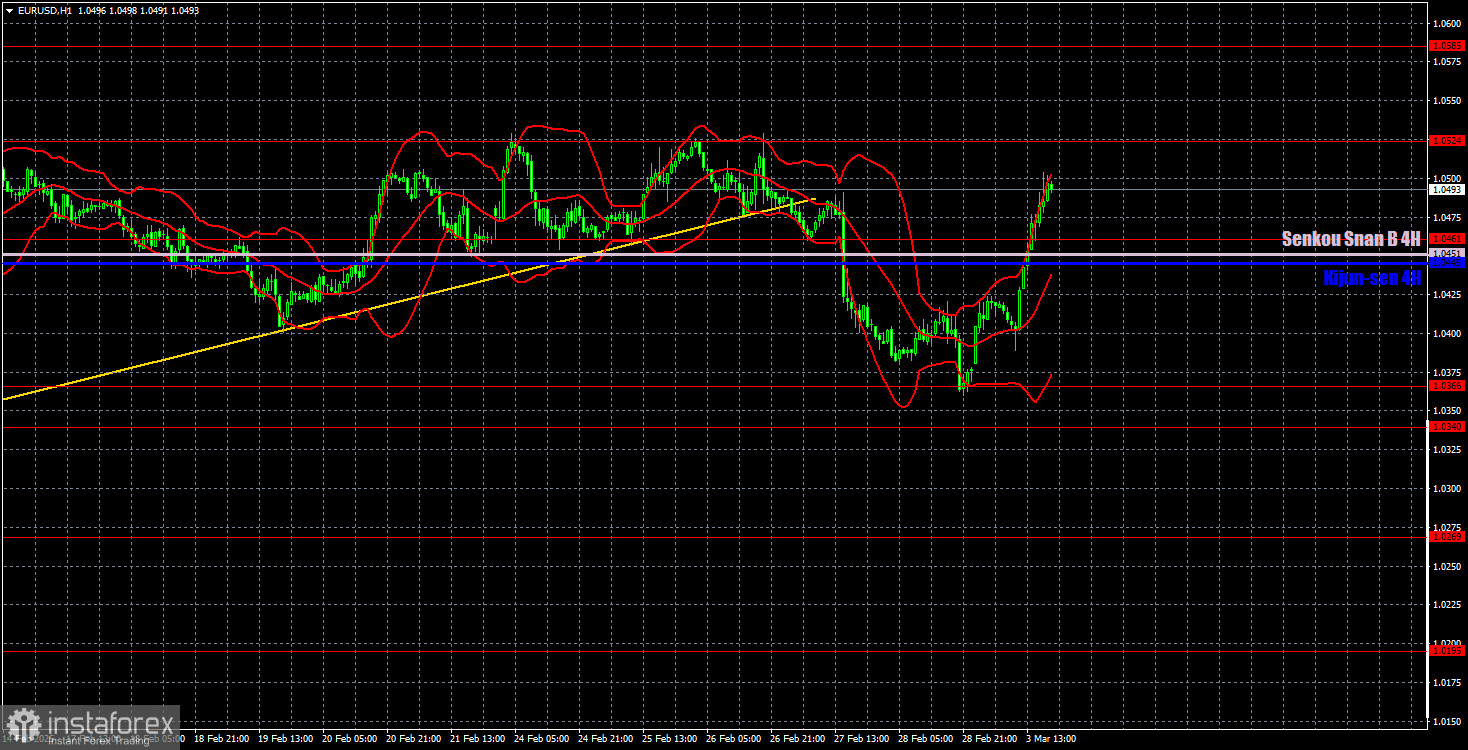
The pair started a long-expected decline on the hourly chart, but Trump introduced chaos into the market. We believe the downtrend will continue in the medium term since the Federal Reserve may only cut rates once or twice in 2025, while the ECB will likely cut much more aggressively. However, in the short term, we could see one or two more upward waves because a correction on the daily timeframe could take a long time and be quite complex. The euro still has no solid reasons for sustained growth. The gains it occasionally posts are 80% technical or driven by market sentiment.
For March 4, we highlight the following trading levels: 1.0124, 1.0195, 1.0269, 1.0340-1.0366, 1.0461, 1.0524, 1.0585, 1.0658-1.0669, 1.0757, 1.0797, 1.0843, as well as the Senkou Span B (1.0451) and Kijun-sen (1.0445) lines. The Ichimoku indicator lines may shift throughout the day, so traders should account for this when identifying trading signals. Remember to set a Stop Loss at breakeven if the price moves 15 pips in the right direction—this will protect against potential losses if a signal turns out to be false.
On Tuesday, the Eurozone is set to release only the unemployment rate, while no significant reports are scheduled in the U.S. However, Donald Trump announced on Monday that he will deliver an important speech in Congress on Tuesday. So, we can expect more "fireworks" in the forex market...
Illustration Explanations:
- Support and Resistance Levels (thick red lines): Thick red lines indicate where movement may come to an end. Please note that these lines are not sources of trading signals.
- Kijun-sen and Senkou Span B Lines: Ichimoku indicator lines transferred from the 4-hour timeframe to the hourly timeframe. These are strong lines.
- Extreme Levels (thin red lines): Thin red lines where the price has previously bounced. These serve as sources of trading signals.
- Yellow Lines: Trendlines, trend channels, or any other technical patterns.
- Indicator 1 on COT Charts: Represents the net position size for each category of traders.


