


Analysis of Trades and Trading Recommendations for the Japanese Yen
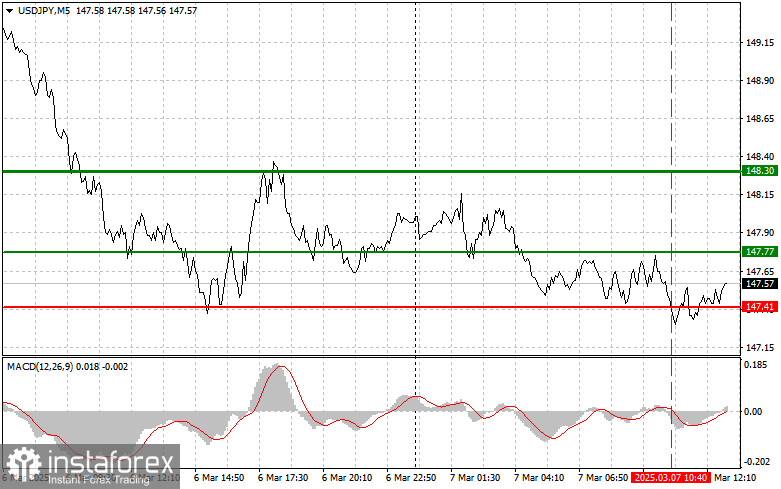
The test of 147.41 occurred when the MACD indicator had already moved significantly below the zero mark, limiting the pair's downward potential. For this reason, I refrained from selling the U.S. dollar.
Today's disappointing Nonfarm Payrolls and Unemployment Rate reports from the U.S. could negatively impact the dollar's position. Market participants are concerned that weak economic data may push the Federal Reserve toward a more cautious monetary policy stance. If job growth exceeds expectations, the dollar may strengthen, though its upward potential in the USD/JPY pair is likely to remain limited due to diverging central bank policies. Conversely, a higher unemployment rate would signal potential economic difficulties in the U.S., further weakening the dollar.
For intraday trading, I will focus on Scenario #1 and Scenario #2.
Buy Signal
The first buying opportunity for USD/JPY today is near 147.69, targeting a rise to 148.30. Around this level, I plan to exit long positions and open short trades, expecting a 30-35 point downward correction. A bullish correction could support this move. Before buying, it is essential to confirm that the MACD indicator is above the zero mark and just beginning to rise.
Another buy opportunity arises if 147.34 is tested twice while the MACD is in oversold territory. This scenario would indicate limited downward potential and a possible reversal upward. The expected targets in this case would be 147.69 and 148.30.
Sell Signal
A short position can be initiated if the price breaks below 147.34, likely triggering a decline toward 146.76. At this level, I plan to exit shorts and open long positions on a rebound, anticipating a 20-25 point correction. Bearish pressure on the pair could emerge at any moment. Before selling, it is crucial to confirm that the MACD is below the zero mark and just beginning to decline.
Another selling opportunity will be available if 147.69 is tested twice while the MACD is in overbought territory. This scenario would indicate limited upward potential and trigger a reversal downward. The expected downward targets would be 147.34 and 146.76.
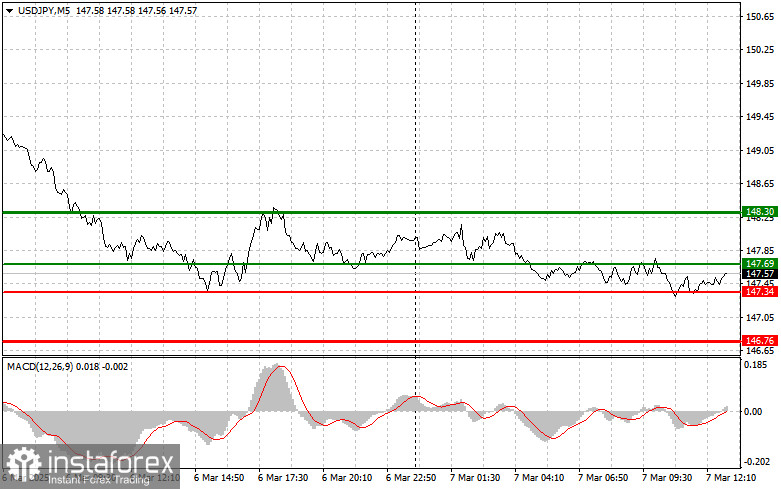
Key Chart Elements
- The thin green line represents the entry price for long positions.
- The thick green line marks a key resistance level where take profit orders or manual profit-taking may be considered, as further growth is unlikely.
- The thin red line represents the entry price for short positions.
- The thick red line marks a potential support level where take profit orders may be placed, as further decline is less likely.
- The MACD indicator should be monitored for overbought and oversold conditions before entering trades.
Final Considerations
Beginner traders should be extremely cautious when entering the market, especially before major economic releases. It is often best to stay out of the market during news events to avoid sudden price fluctuations. If trading during these periods, always use stop-loss orders to minimize losses. Trading without stop-loss protection can quickly deplete capital, especially for those using large position sizes.
To trade successfully, it is crucial to have a structured trading plan, such as the one outlined above. Making impulsive trading decisions based on short-term market conditions is an inherently losing strategy for intraday traders.


