


Analysis of Friday's Trades
1H Chart of EUR/USD
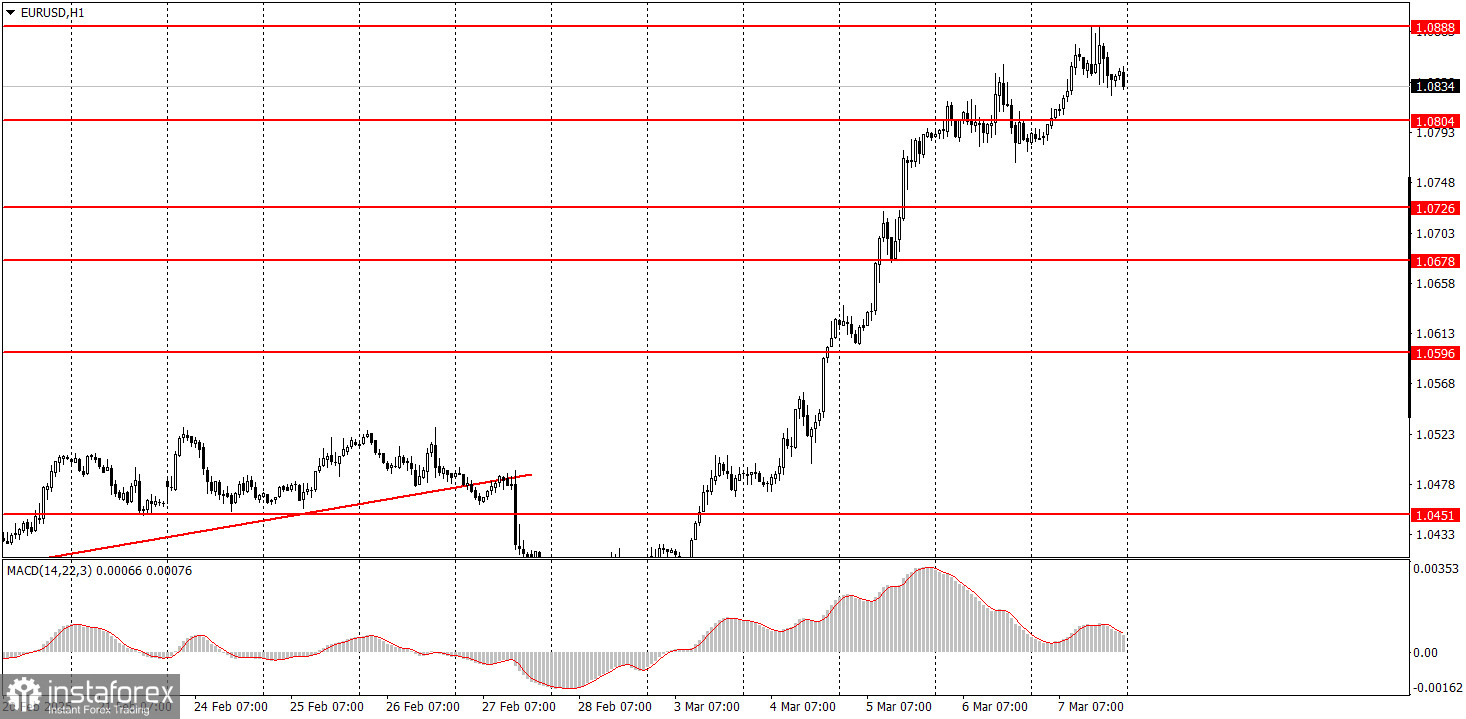
On Friday, following a brief pause on Thursday, the EUR/USD currency pair resumed its upward movement. A look at the macroeconomic calendar might suggest that the euro's rise was entirely justified. The Eurozone GDP report exceeded expectations, while the U.S. Non-Farm Payrolls report was weaker than anticipated, with unemployment unexpectedly rising to 4.1%. However, a closer examination of the 5-minute timeframe indicates that most of the euro's growth occurred in the first half of the day, prior to the GDP report's release. In the latter half of the day, despite the release of disappointing U.S. data, the pair did not continue to rise. This suggests that the market was buying euros without paying much attention to the macroeconomic context. It's important to note that the price failed to break above the 1.0888–1.0896 range, resulting in a modest gain of only 460 pips for the week.
5M Chart of EUR/USD
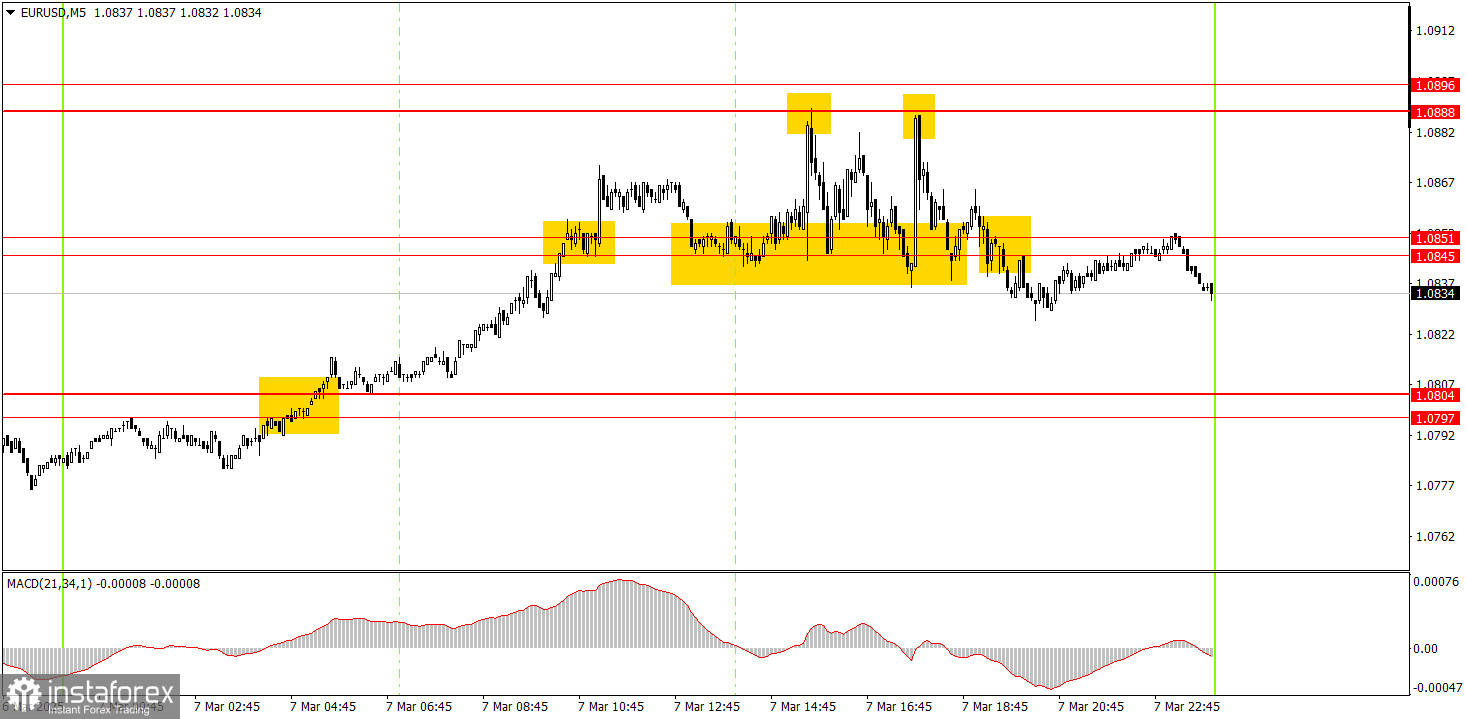
On the 5-minute timeframe, several trading signals were generated on Friday. The strongest signal emerged during the Asian session after a breakout from the 1.0797–1.0804 range. Throughout the rest of the day, the price traded within the 1.0845–1.0888 range, frequently testing its limits. While most signals were profitable, the narrow range limited the potential profit of each trade. Nonetheless, it was virtually impossible for the day to end with losses.
Trading Strategy for Monday:
On the hourly timeframe, EUR/USD remains in a medium-term downtrend. The fundamental and macroeconomic background favors the U.S. dollar far more than the euro, so further declines are expected. Current observations indicate a decline in the dollar, not euro growth, attributed to Donald Trump's policies. There are no other reasons for the pair's rise.
On Monday, the euro may trade in either direction, as the macroeconomic and fundamental background currently has little influence on the pair's movement. If someone thinks the euro can't continue rising, that's not necessarily true.
On the 5-minute timeframe, key levels to watch are 1.0334–1.0359, 1.0433–1.0451, 1.0526, 1.0596, 1.0678, 1.0726–1.0733, 1.0797–1.0804, 1.0845–1.0851, 1.0888–1.0896, and 1.0940–1.0952. On Monday, there will be very few macroeconomic events in the Eurozone or the U.S., but at this point, those reports are mostly irrelevant. Over the weekend, Trump may make a few more high-profile statements, meaning Monday could unfold again under the banner of "Make America Great Again."
Core Trading System Rules:
- Signal Strength: The shorter the time it takes for a signal to form (a rebound or breakout), the stronger the signal.
- False Signals: If two or more trades near a level result in false signals, subsequent signals from that level should be ignored.
- Flat Markets: In flat conditions, pairs may generate many false signals or none at all. It's better to stop trading at the first signs of a flat market.
- Trading Hours: Open trades between the start of the European session and the middle of the US session, then manually close all trades.
- MACD Signals: On the hourly timeframe, trade MACD signals only during periods of good volatility and a clear trend confirmed by trendlines or trend channels.
- Close Levels: If two levels are too close (5–20 pips apart), treat them as a support or resistance zone.
- Stop Loss: Set a Stop Loss to breakeven after the price moves 15 pips in the desired direction.
Key Chart Elements:
Support and Resistance Levels: These are target levels for opening or closing positions and can also serve as points for placing Take Profit orders.
Red Lines: Channels or trendlines indicating the current trend and the preferred direction for trading.
MACD Indicator (14,22,3): A histogram and signal line used as a supplementary source of trading signals.
Important Events and Reports: Found in the economic calendar, these can heavily influence price movements. Exercise caution or exit the market during their release to avoid sharp reversals.
Forex trading beginners should remember that not every trade will be profitable. Developing a clear strategy and practicing proper money management are essential for long-term trading success.


