


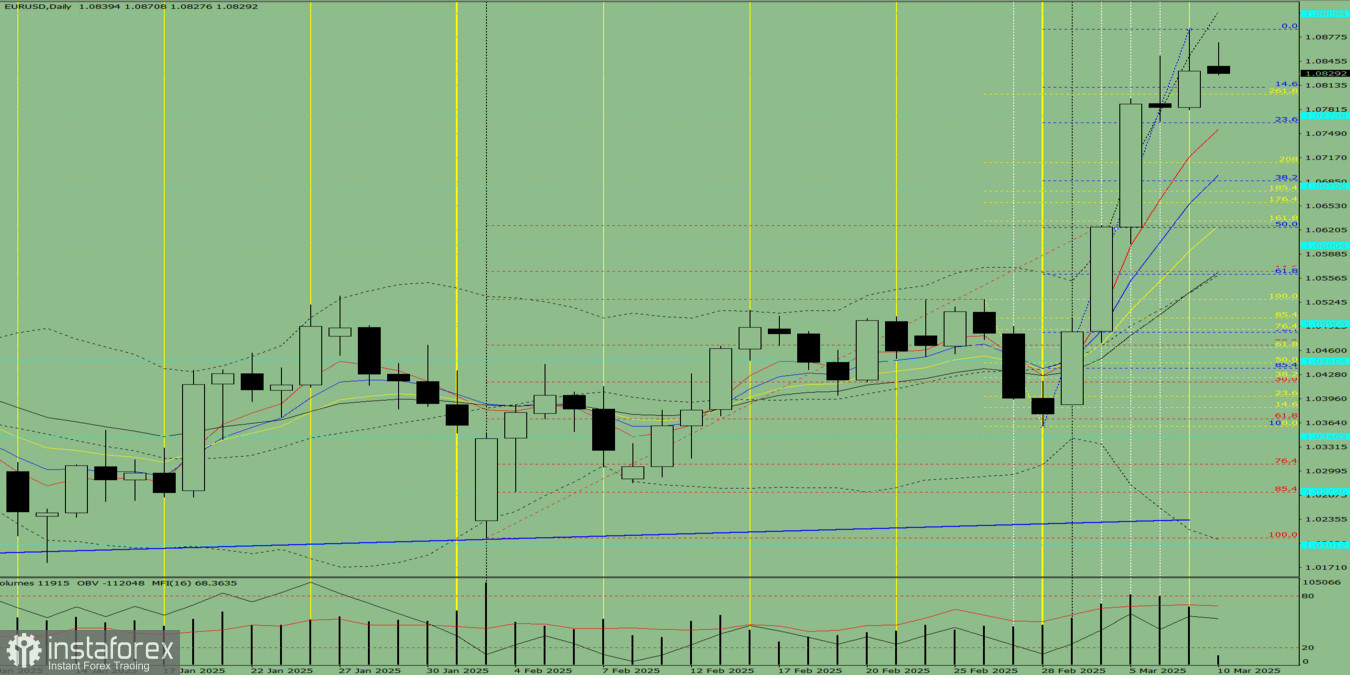
Trend Analysis (Fig. 1):
On Monday, the market, starting from 1.0833 (Friday's daily close), may continue moving downward toward 1.0811, which corresponds to the 14.6% retracement level (blue dashed line). If this level is reached, the price may then begin an upward movement toward 1.0909, a historical resistance level (light blue dashed line).
Comprehensive Analysis:
- Indicator Analysis – Down
- Fibonacci Levels – Down
- Volume Analysis – Down
- Candlestick Patterns – Down
- Trend Analysis – Up
- Bollinger Bands – Down
- Weekly Chart – Down
Overall Conclusion: The general trend remains bearish.
Alternative Scenario:
If the price continues downward from 1.0833 (Friday's daily close), it may reach 1.0763 (the 23.6% retracement level, blue dashed line). Upon reaching this level, a corrective upward movement toward 1.0909 (historical resistance, light blue dashed line) is possible.


