


In my morning forecast, I highlighted the 1.2881 level as a key entry point. Let's examine the 5-minute chart to analyze what happened. A decline and formation of a false breakout at 1.2881 created a buying opportunity, leading to a 20-point increase in the pair. The technical outlook has been revised for the second half of the day.

Long Position Strategy for GBP/USD:
The lack of U.K. economic data and a healthy correction in the pair have attracted new pound buyers, anticipating further bullish momentum. Unfortunately, the second half of the day also lacks fundamental data, suggesting that the pair may trade within the range formed over the two previous sessions.
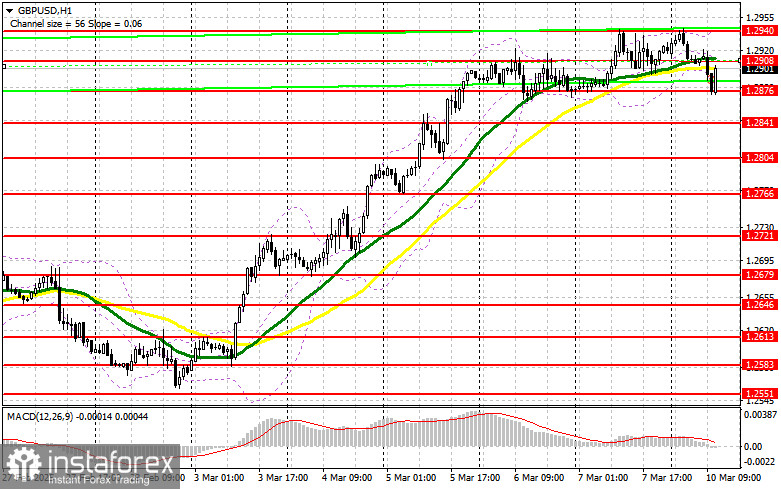
If GBP/USD declines, only a false breakout at 1.2876 will provide a strong entry point for long positions, aiming for a recovery to 1.2908 resistance. A break and retest of this level from above will confirm a new buy signal, opening the door for an advance toward 1.2940, which will restore the bullish trend. The final target is 1.2972, where I will take profit.
If GBP/USD falls and buyers fail to show activity at 1.2876, bearish pressure will increase, and the pair will continue its downward correction. In this case, I will consider long positions only after a false breakout at the 1.2841 low. Alternatively, I plan to buy on a direct rebound from 1.2804, targeting a 30–35 point intraday correction.
Short Position Strategy for GBP/USD:
Sellers attempted to gain control but immediately encountered strong buyer activity. In the second half of the session, attention shifts to defending the 1.2908 resistance, which formed during the European session. A false breakout at this level will provide a strong sell entry, targeting a decline to 1.2876.
A break and retest of 1.2876 from below will trigger stop-loss orders, clearing the way for a move to 1.2841. The final target will be 1.2804, where I plan to lock in profits. A test of this level could halt the pound's bullish momentum.
If demand for the pound remains strong in the second half of the day, and sellers do not show activity at 1.2908 (where the moving averages are positioned), the pair will likely continue rising. In this case, I will delay short positions until the next resistance at 1.2940. I will only sell after an unsuccessful consolidation at this level. If no bearish signals appear there, I will consider shorts from 1.2972, expecting a 30–35 point downward correction.
Commitments of Traders (COT) Report:
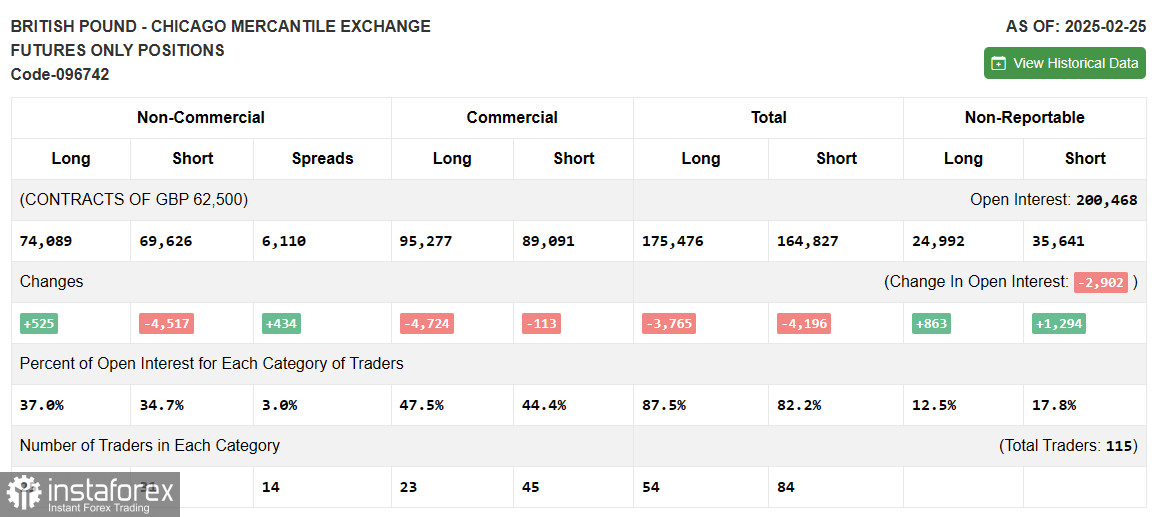
The COT report for February 25 indicated a minimal increase in long positions and a reduction in short positions. The balance is shifting in favor of buyers, suggesting further GBP/USD growth.
Considering the positive geopolitical trends, particularly regarding conflict resolution in Ukraine, along with relatively stable U.K. economic data, pound buyers remain active. Non-commercial long positions increased by 525 to 74,089. Non-commercial short positions decreased by 4,517 to 69,626. The net gap between long and short positions widened by 434.
Indicator Signals
Moving Averages
The pair is trading near the 30 and 50-period moving averages, indicating continued market uncertainty.
Bollinger Bands
If the pair declines, the lower Bollinger Band at 1.2876 will act as support.
Key Indicator Descriptions:
- Moving Averages (MA): Identify the current trend by smoothing price fluctuations.
- 50-period MA: Marked in yellow.
- 30-period MA: Marked in green.
- MACD (Moving Average Convergence/Divergence): Identifies momentum shifts.
- Fast EMA – 12-period
- Slow EMA – 26-period
- Signal line SMA – 9-period
- Bollinger Bands: Measure volatility and overbought/oversold conditions.
- 20-period setting used.
- Non-commercial traders: Include hedge funds, institutional investors, and speculative traders who do not hedge but seek profit from price movements.
- Long non-commercial positions: Represent the total long positions held by speculative traders.
- Short non-commercial positions: Represent the total short positions held by speculative traders.
- Net non-commercial position: The difference between long and short positions.


