


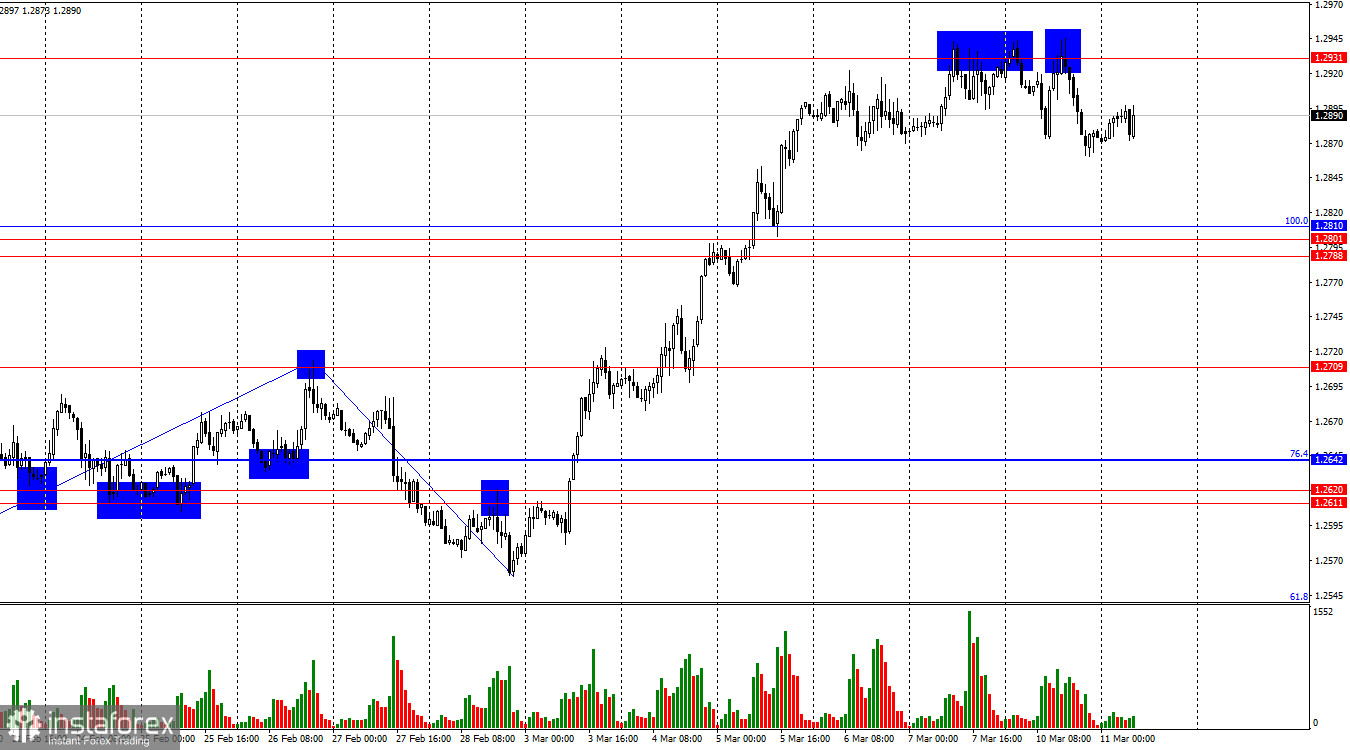
On the hourly chart, the GBP/USD pair made its third rebound from the 1.2931 level on Monday, leading to a decline toward 1.2865. A bounce from this level could lead to a return of the British pound to 1.2931. However, if the pair consolidates below 1.2865, the probability of a further decline toward the 100.0% Fibonacci level at 1.2810 will increase. Bulls showed some weakness on Monday but are not retreating from the market.
The wave structure is absolutely clear. The last completed downward wave did not break the previous low, while the last upward wave broke the previous peak. This suggests that a bullish trend is still forming. The pound has shown very strong growth recently, perhaps excessively strong. However, the fundamental backdrop is not particularly supportive of uninterrupted bullish rallies.
There was no significant economic news on Monday, which made the pound's decline somewhat surprising at first glance. However, after last week's strong rally, a correction was expected by all traders. The only issue is that the strength of the bulls is preventing a full-fledged pullback. Traders remain highly skeptical about current developments in the United States. The situation is not limited to import tariffs—Donald Trump also intends to withdraw from the United Nations and NATO, making statements that contradict U.S. policies of recent years and even decades. Essentially, Trump is reshaping everything to his own vision.
First, I doubt that a single individual can completely change both domestic and foreign policy within just four years. Second, mass protests have already begun in the U.S. against Trump's presidency, as Americans take to the streets opposing his policies, which are escalating tensions with many allied nations. The U.S. stock market has been falling since Trump took office, which is displeasing for everyone—consumers, who are forced to pay higher prices due to tariffs, and investors, who are losing money.
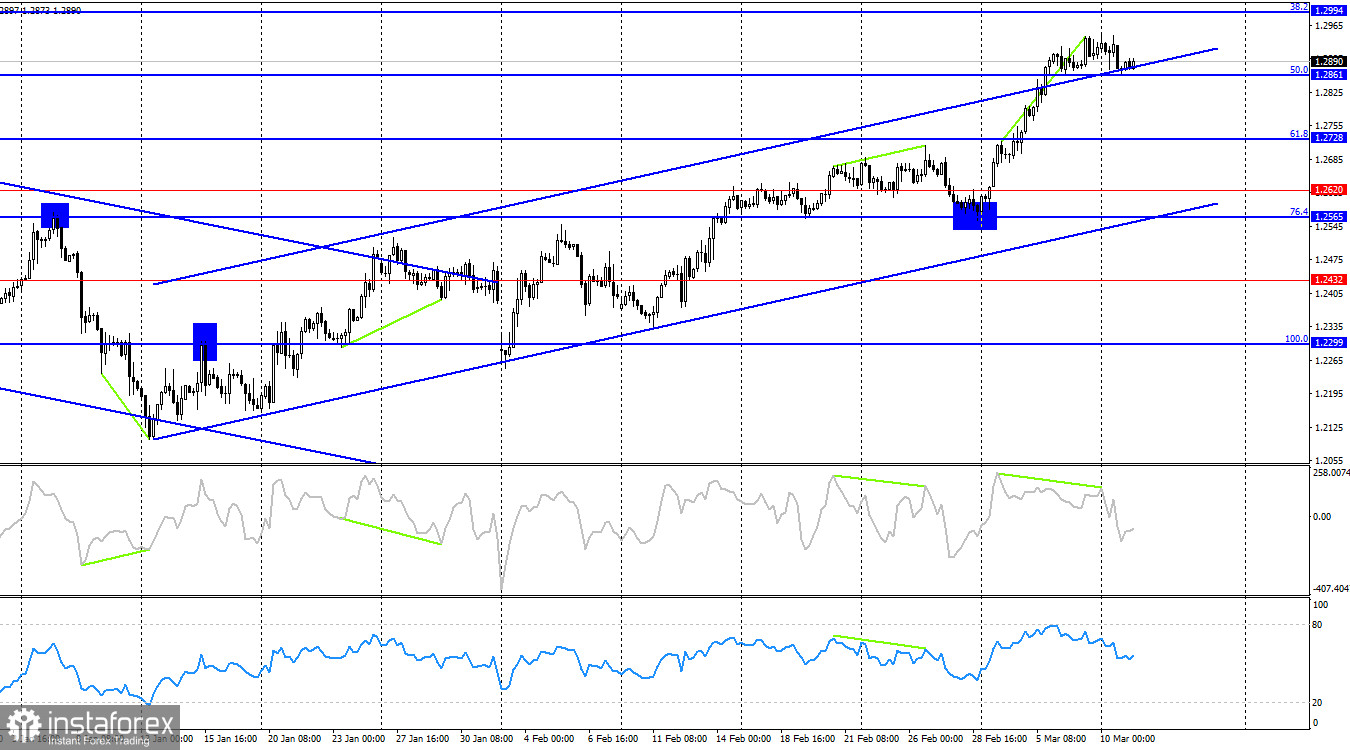
On the four-hour chart, the pair continues to rise and has consolidated above the 50.0% Fibonacci level at 1.2861, allowing for further upside toward the next retracement level of 38.2% at 1.2994. I do not expect a strong decline in the pound unless the pair breaks below the ascending channel. However, the CCI indicator has formed a bearish divergence, and if the pair closes below 1.2861, we could see further downside toward the 61.8% Fibonacci level at 1.2728.
Commitments of Traders (COT) Report:
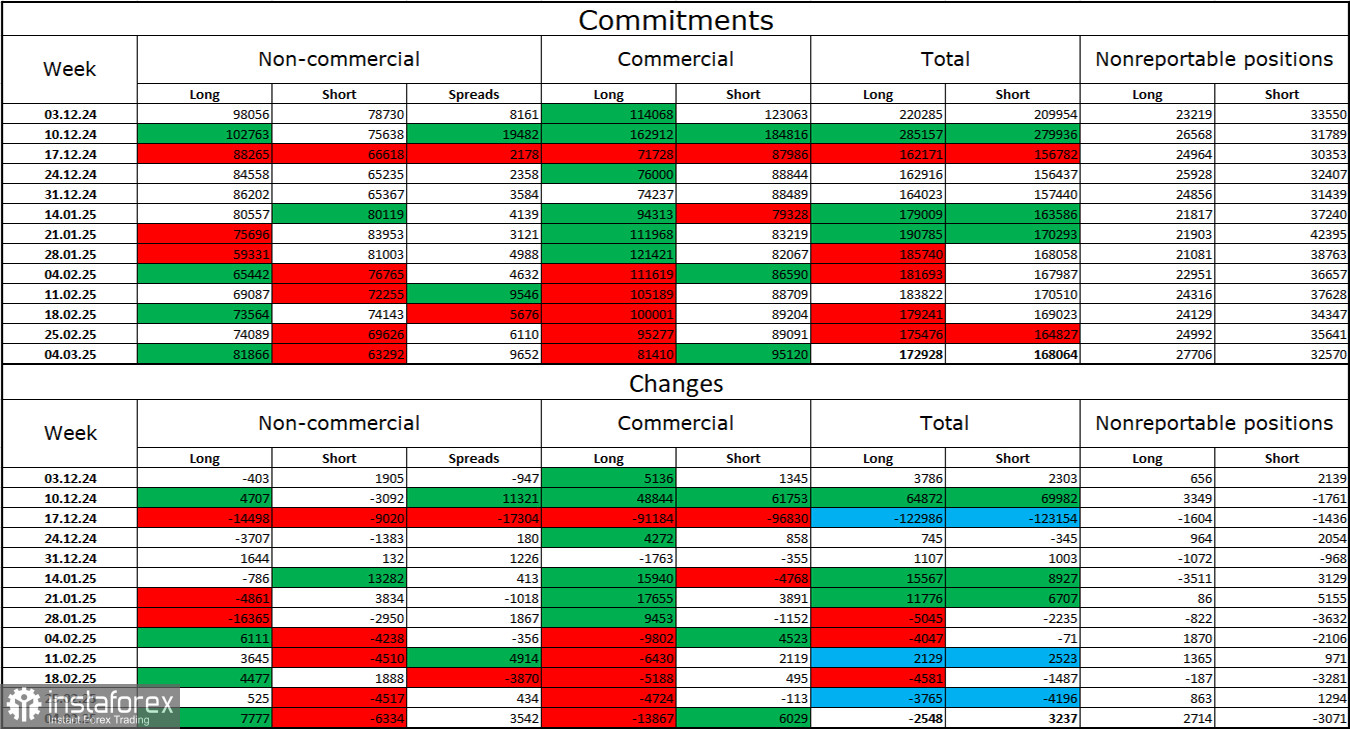
The Non-commercial category of traders became slightly less bearish over the last reporting week. The number of long positions increased by 7,777, while short positions decreased by 6,334. Bears have lost their advantage in the market, with the gap between long and short positions now standing at nearly 20,000 in favor of bulls: 82,000 vs. 63,000.
I believe that the pound still has downward potential, but recent developments could shift the market's direction in the long term. Over the past three months, the number of long positions has declined from 98,000 to 81,000, while the number of short positions has dropped from 78,000 to 63,000. In my view, professional traders may start reducing their long positions or increasing short positions, as most possible bullish factors supporting the pound have already played out. However, a sharp shift in market sentiment toward the U.S. economy due to Trump's policies could prevent traders from buying the dollar and selling the pound.
Economic Calendar for the U.S. and the U.K.:
United States – JOLTS Job Openings (14:00 UTC)
On Tuesday, the economic calendar contains only one second-tier report. As a result, the impact of news on market sentiment is expected to be minimal or absent altogether.
GBP/USD Forecast and Trading Recommendations:
Selling the pair was possible after a rebound from 1.2931 on the hourly chart, with a target at 1.2810. These trades can still be held open with a stop-loss at breakeven. Buying opportunities will arise after a rebound from 1.2865 on the hourly chart or if the pair closes above 1.2931, with a target at 1.2994.
Fibonacci retracement grids are drawn from 1.2809–1.2100 on the hourly chart and 1.2299–1.3432 on the four-hour chart.


