


Trend Analysis (Fig. 1)
On Thursday, the market may continue moving downward from 1.0886 (yesterday's daily close) toward 1.0861 – the 14.6% Fibonacci retracement level (blue dashed line). From this level, a rebound upward toward 1.0897 – the upper fractal (blue dashed line) – is possible.
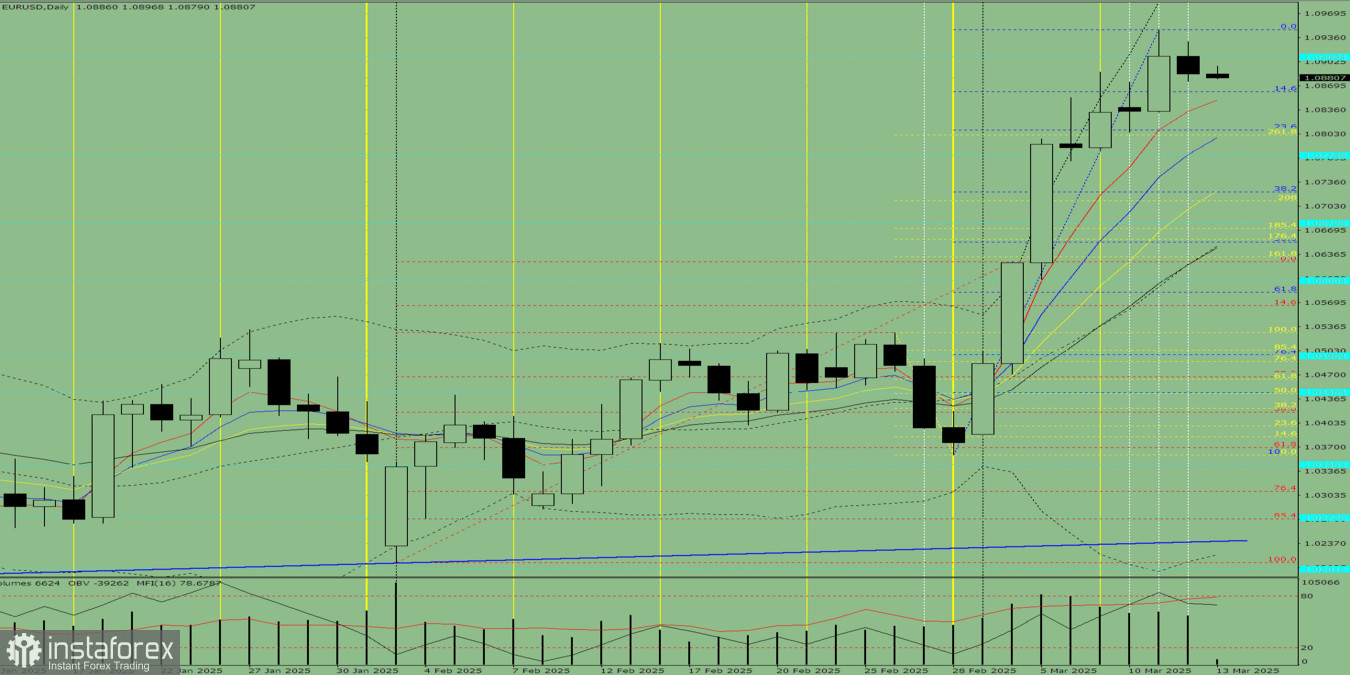
Fig. 1 (Daily Chart)
Comprehensive Analysis:
- Indicator Analysis – Downward
- Fibonacci Levels – Downward
- Volumes – Downward
- Candlestick Analysis – Downward
- Trend Analysis – Upward
- Bollinger Bands – Upward
- Weekly Chart – Downward
Overall Conclusion: Bearish Movement Expected
Alternative Scenario:
On Thursday, the market may continue declining from 1.0886 (yesterday's daily close) toward 1.0808 – the 23.6% Fibonacci retracement level (blue dashed line). From this level, the price may rebound upward toward 1.0861 – the 14.6% Fibonacci retracement level (blue dashed line).


