


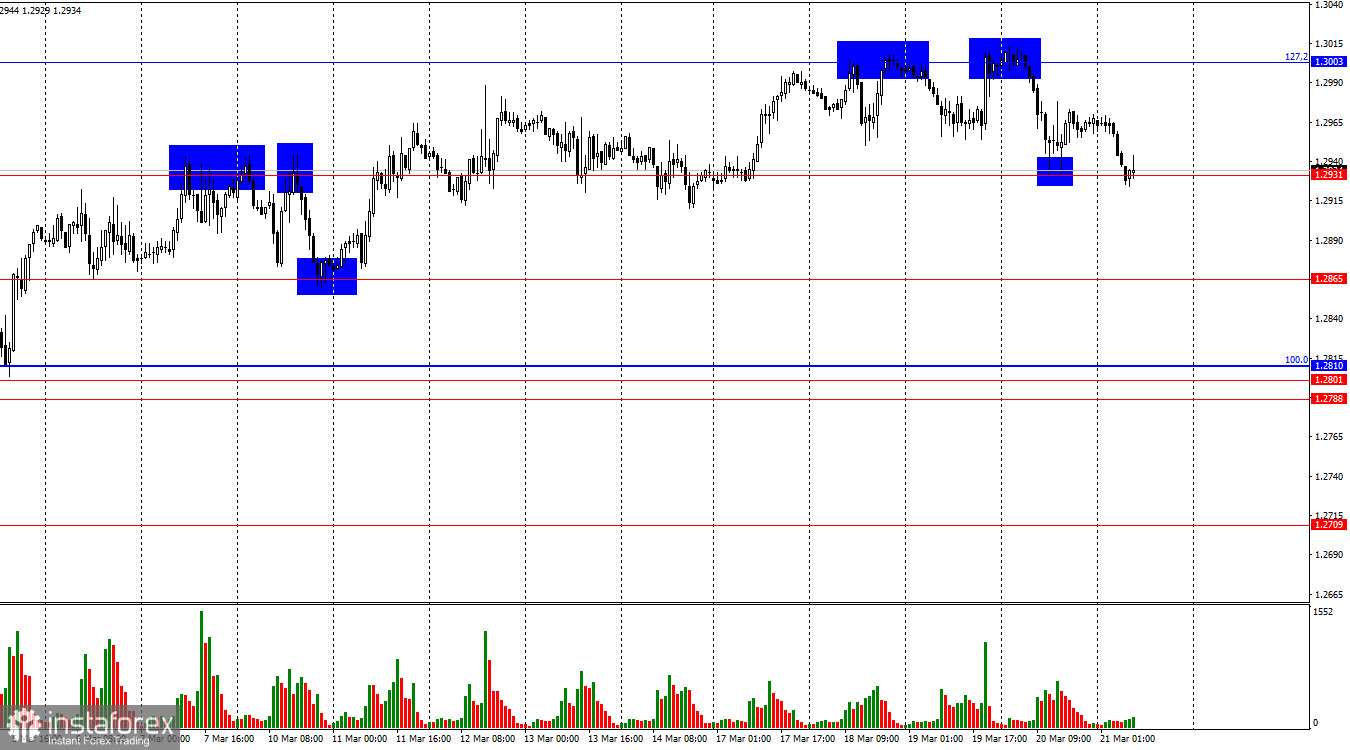
On the hourly chart, the GBP/USD pair on Thursday dropped to the 1.2931 level, rebounded from it, saw a slight rise, and returned to 1.2931 again on Friday morning. A new rebound from this level would once again favor the British pound and support some growth toward the 127.2% Fibonacci level at 1.3003. A consolidation below 1.2931 would increase the likelihood of a continued decline toward the next support level at 1.2865. For now, bears are doing their best to break the bullish trend, but they lack sufficient strength.
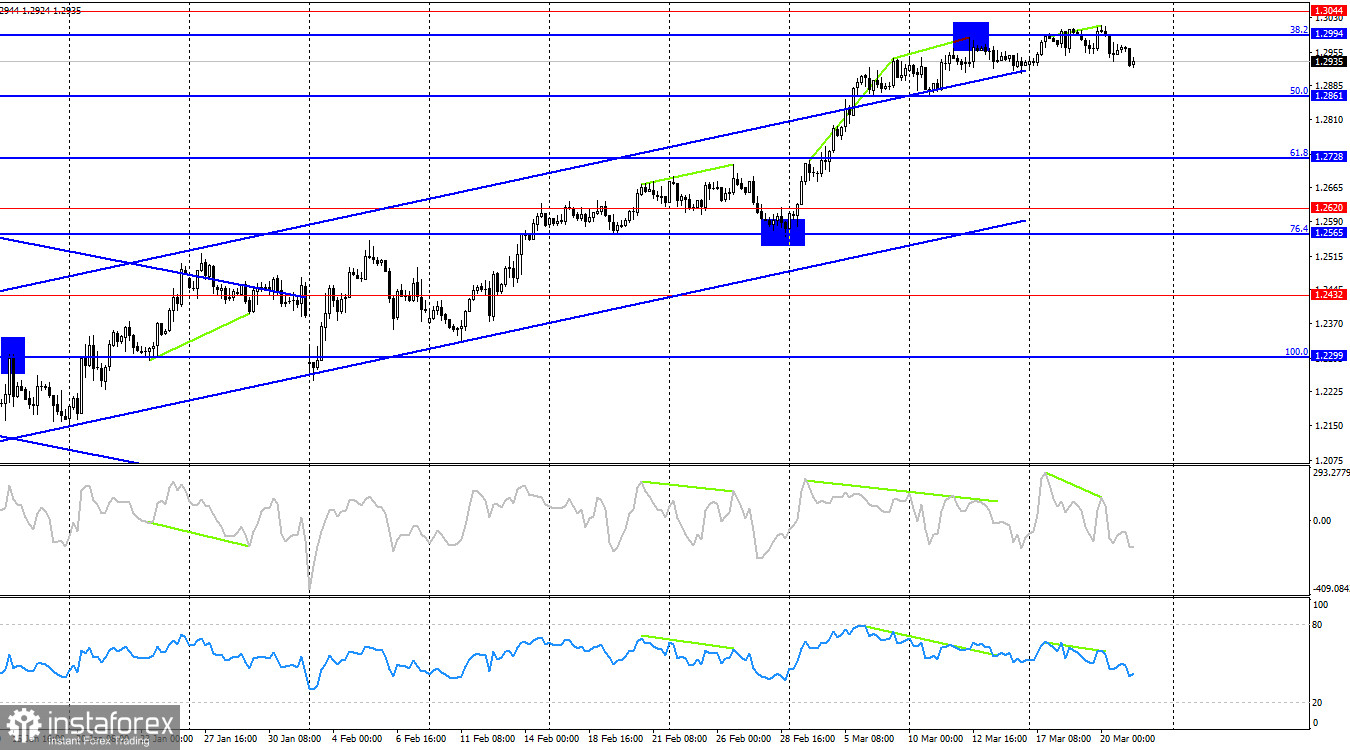
On the 4-hour chart, the pair remains in an uptrend. A significant decline in the pound is unlikely unless there is a close below the ascending channel. The CCI indicator has formed another bearish divergence, which, like the previous one, has yet to impact bullish positions. A rejection from the 1.2994 level would indicate potential weakness and suggest a decline toward the 50.0% Fibonacci level at 1.2861.
Commitments of Traders (COT) Report:
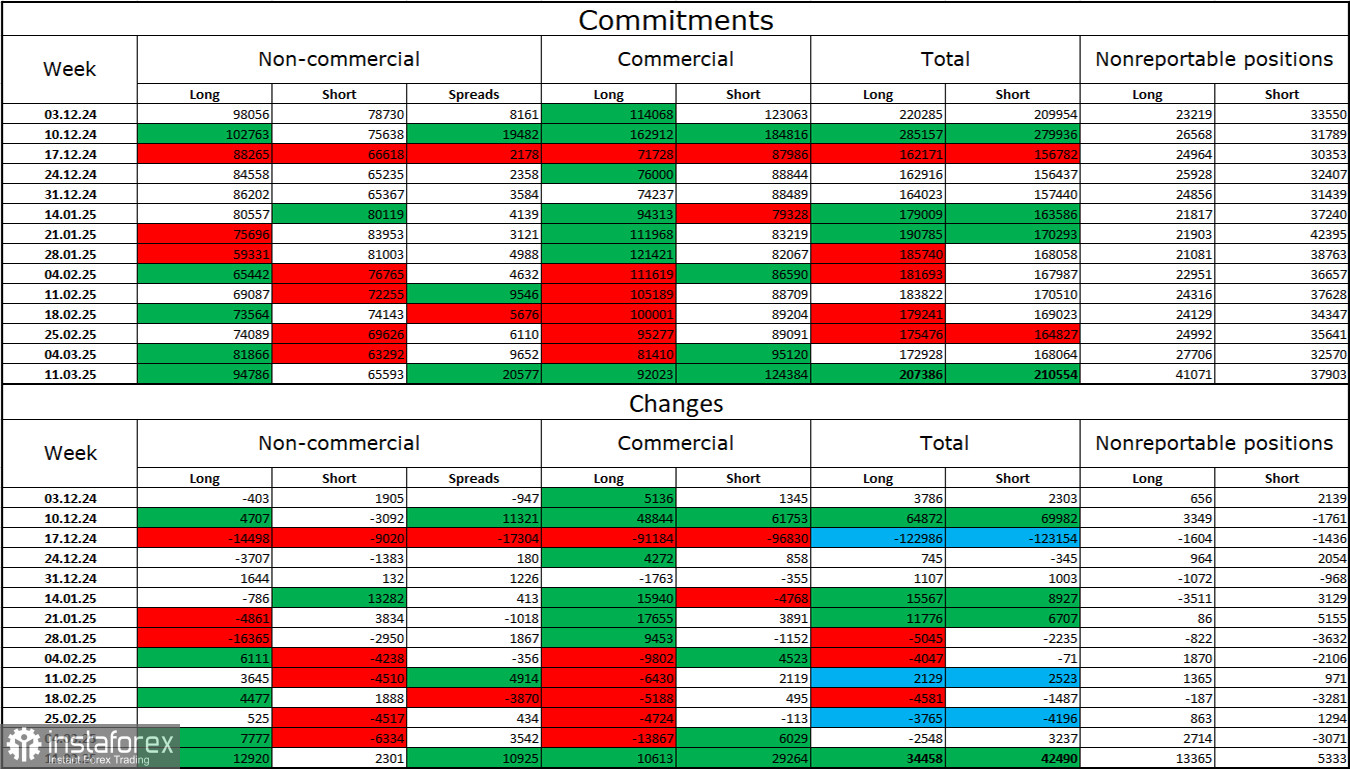
Sentiment among "Non-commercial" traders became more bullish over the last reporting week. The number of long positions held by speculators increased by 12,920, while short positions rose by only 2,301. Bears have lost their advantage. The gap between long and short positions now stands at nearly 30,000 in favor of the bulls: 95,000 vs. 66,000.
In my view, the pound still has downward potential, but recent developments could lead the market to shift direction in the long term. Over the past three months, the number of long positions fell from 98,000 to 94,000, and shorts dropped from 78,000 to 66,000. However, more importantly, over the past six weeks, long positions rose from 59,000 to 95,000, while short positions dropped from 81,000 to 66,000. Let me remind you, these are the "six weeks of Trump's influence".
Economic Calendar for the U.S. and UK:
Friday's economic calendar is empty. Therefore, fundamental news will have no influence on market sentiment today.
GBP/USD Forecast and Trading Tips:
Selling the pair was possible on a rebound from 1.3003 on the hourly chart, targeting 1.2931 and 1.2865. The first target has been reached. A close below it would justify keeping short positions open with the second target in mind. Buying is possible on a fresh rebound from 1.2931 on the hourly chart, targeting 1.3003.
Fibonacci grids are drawn from 1.2809 to 1.2100 on the hourly chart, and from 1.2299 to 1.3432 on the 4-hour chart.


