


Yesterday, the S&P 500 stock index posted a solid gain of 1.76%, reaching the target level of 5769 (the low from January 13). At the same time, the signal line of the Marlin oscillator touched the boundary of the uptrend territory.
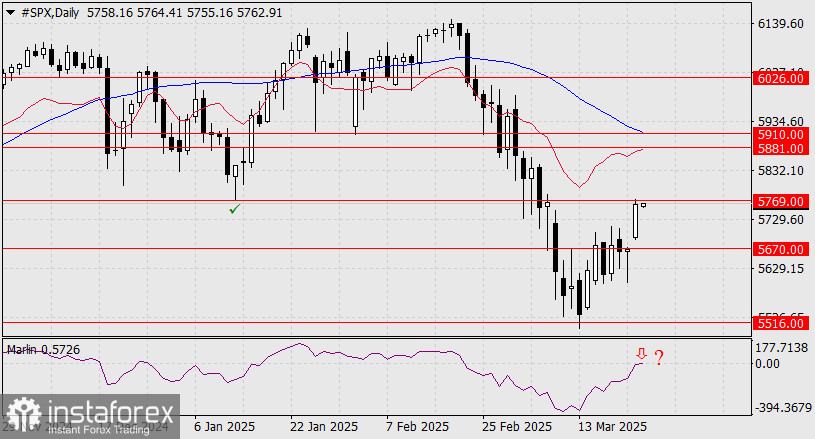
This synchronization in testing key levels marks a bifurcation point—price will either reverse back toward 5516 or continue a rapid rise toward the target range of 5881–5910, where the MACD line is now entering, reinforcing this area. A daily close above 5769 will indicate the continuation of the upward trend. If today's session ends with a bearish candlestick, the bears' first target will be the support level at 5670.
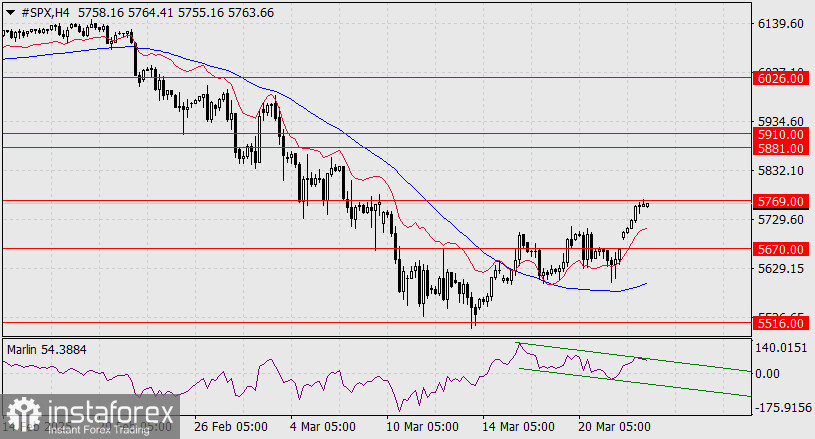
The Marlin oscillator is moving within a descending channel on the four-hour chart. As the oscillator remains in positive territory, a breakout to the upside is certainly possible. Additionally, the MACD line is turning upward, indicating the direction of the short-term trend. The current trend is upward, but confirmation is still needed.


