


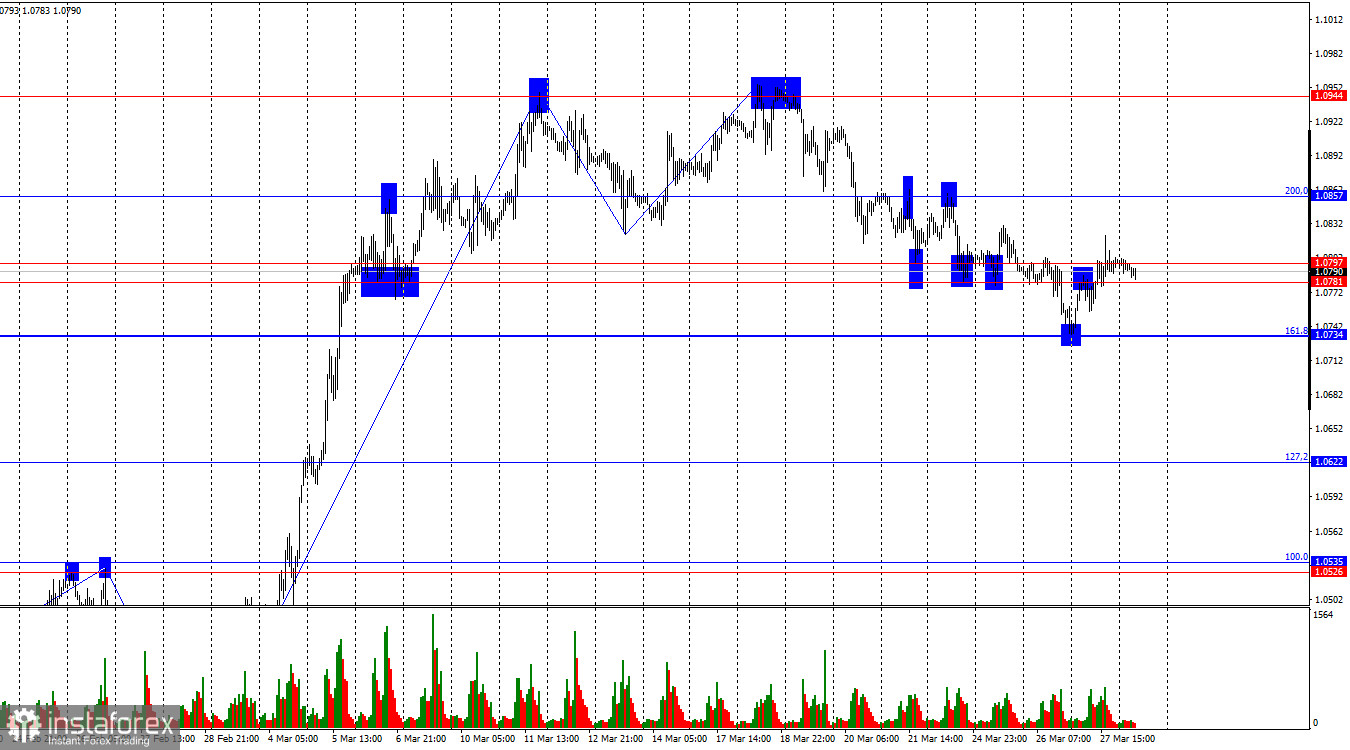
The wave structure on the hourly chart has changed. The last completed upward wave broke the previous peak by just a few points, while the last downward wave broke the previous low. This suggests a gradual trend reversal in a bearish direction. Donald Trump's tariffs have put strong pressure on the dollar over the past few weeks, but the market has reacted rather weakly to the latest round of tariffs.
Thursday's news background was important, but not in the way traders had hoped. Overnight, it was announced that Donald Trump had imposed 25% tariffs on all imported cars, rendering the rest of the day's events irrelevant for market participants. The dollar remained under pressure all day, even despite stronger-than-expected U.S. GDP data. Countries affected by the new tariffs, especially the European Union, are likely preparing a response. We are clearly in the midst of a trade war. However, traders are no longer rushing to sell the dollar. While the dollar fell all day yesterday, the decline was not particularly strong. The market is gradually coming to terms with the new reality, which implies that more rounds of tariffs from the U.S. are likely. If the dollar falls with each new round, it could soon drop to around 1.20. Still, the dollar's value should be influenced by more than just Trump—and the market understands that. As mentioned, the U.S. GDP report beat expectations.
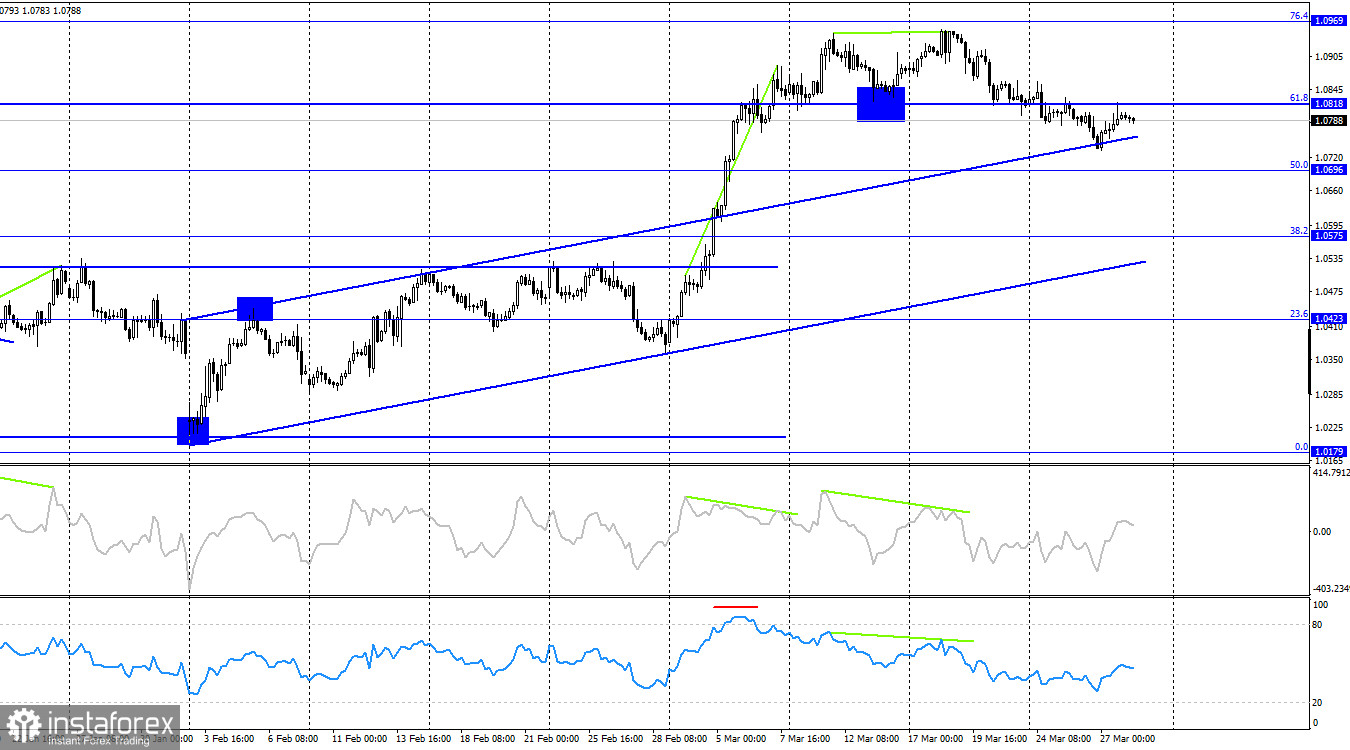
On the 4-hour chart, the pair reversed in favor of the U.S. dollar following the formation of another bearish divergence and a consolidation below the 61.8% Fibonacci level at 1.0818. This suggests continued decline toward the next retracement level at 50.0% – 1.0696. The euro still has room to fall, as the price remains above the upward trend channel. No emerging divergences are currently observed on any indicator.
Commitments of Traders (COT) Report:
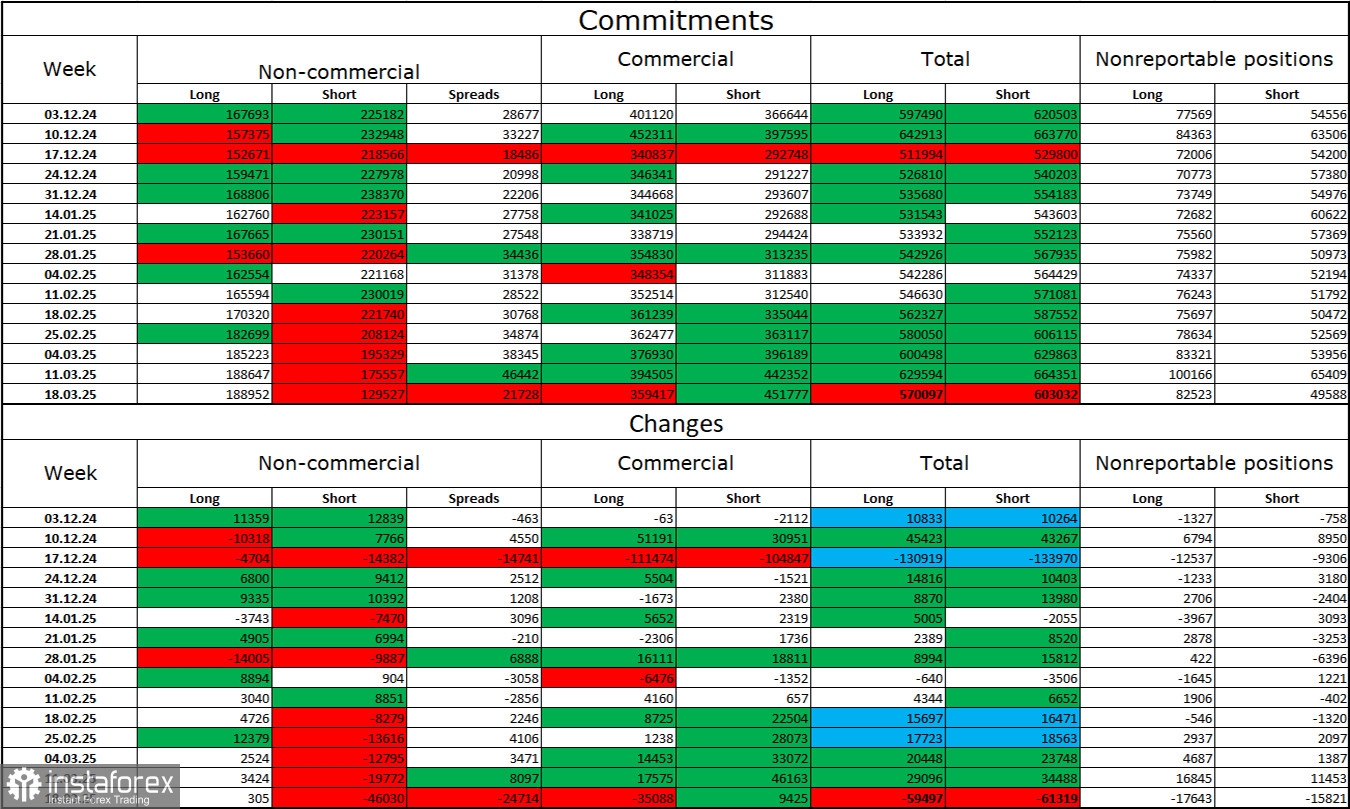
During the most recent reporting week, professional traders opened 305 long positions and closed 46,030 short positions. The "Non-commercial" group's sentiment has once again turned bullish—thanks to Donald Trump. The total number of long positions held by speculators now stands at 189,000, while short positions have dropped to 129,000.
For twenty consecutive weeks, large players were shedding euro positions, but they've now been reducing short positions and increasing long ones for six straight weeks. The diverging paths in monetary policy between the ECB and the Fed still favor the U.S. dollar due to the widening interest rate differential. However, Trump's policy is a stronger factor for traders, as it could have a dovish effect on the FOMC and even lead to a recession in the U.S. economy.
Economic Calendar for the U.S. and the Eurozone:
- Eurozone – Germany Unemployment Rate (08:55 UTC)
- U.S. – PCE Price Index (12:30 UTC)
- U.S. – Personal Income and Spending (12:30 UTC)
- U.S. – University of Michigan Consumer Sentiment Index (14:00 UTC)
On March 28, the economic calendar includes four events, none of which are considered highly important. As a result, the impact of news flow on market sentiment on Friday may be limited.
EUR/USD Forecast and Trading Tips:
Selling the pair was possible after a close below the 1.0781–1.0797 zone, targeting 1.0734 and 1.0622. The first target has been reached. Today, short positions can be considered on a bounce from the 1.0781–1.0797 zone with the same targets. Long positions may be considered on an hourly close above this zone, targeting 1.0857, but for now, bears remain in control.
Fibonacci levels are plotted from 1.0529 to 1.0213 on the hourly chart and from 1.1214 to 1.0179 on the 4-hour chart.


