


Trade Review and Trading Tips for the Japanese Yen
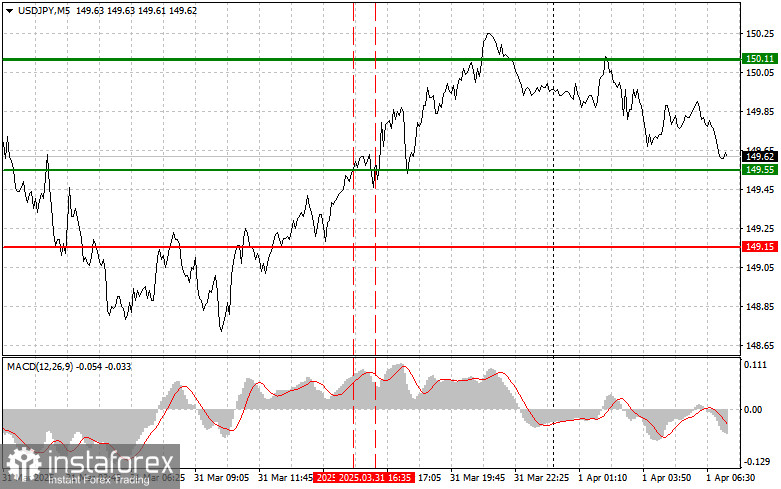
The test of the 149.55 level occurred at a moment when the MACD indicator had already moved significantly above the zero line, which limited the pair's upward potential. For that reason, I didn't buy the dollar. Shortly after, another test of the 149.55 level with the MACD in the overbought zone led to the implementation of Scenario #2 for selling, which resulted in a loss since the pair failed to decline.
Today's strong data on Japan's Large Manufacturers Index, Non-Manufacturing Activity Index, and the Tankan Index for capital expenditures of large enterprises led to yen strengthening and a decline in the U.S. dollar. Notably, the large manufacturers' index showed steady growth, indicating recovery in manufacturing capacity and rising order volumes. The non-manufacturing index also exceeded expectations, reflecting expansion in the services sector and improved consumer confidence.
Special attention was paid to the Tankan Index for capital expenditures by large enterprises, which reflects companies' intentions to invest in production development and modernization. The positive reading signals long-term optimism among Japanese businesses and confidence in future economic growth.
As for the intraday strategy, I will continue to rely primarily on Scenarios #1 and #2.
Buy Scenarios
Scenario #1: I plan to buy USD/JPY today at the entry point around 149.93 (green line on the chart), targeting a rise to 150.60 (thicker green line on the chart). Around 150.60, I will exit long positions and open short ones in the opposite direction (aiming for a 30–35 point reversal). It's best to buy the pair during pullbacks or significant dips in USD/JPY. Important: Before buying, make sure the MACD is above the zero line and just beginning to rise from it.
Scenario #2: I also plan to buy USD/JPY if the price tests 149.40 twice in a row while the MACD is in the oversold area. This will limit the pair's downward potential and lead to an upward market reversal. A rise to the opposite levels of 149.93 and 150.60 can be expected.
Sell Scenarios
Scenario #1: I plan to sell USD/JPY today only after breaking below the 149.40 level (red line on the chart), which should lead to a rapid decline. The key target for sellers will be 148.78, where I'll exit short positions and immediately open long ones (targeting a 20–25 point bounce). Downward pressure on the pair can return at any moment. Important: Before selling, make sure the MACD is below the zero line and just beginning to decline from it.
Scenario #2: I also plan to sell USD/JPY today if the price tests 149.93 twice in a row while the MACD is in the overbought zone. This will limit the pair's upward potential and lead to a market reversal downward. A decline to the opposite levels of 149.40 and 148.78 can be expected.
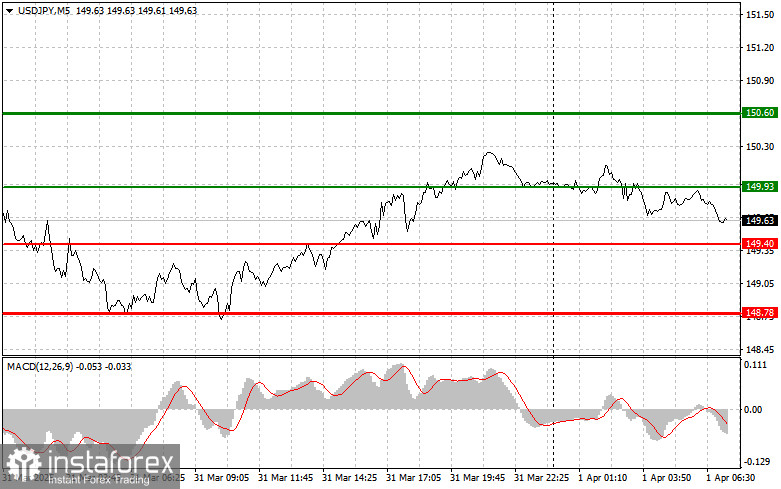
Chart Key:
- Thin green line – entry price for buying the trading instrument.
- Thick green line – target price to place Take Profit or manually secure profits, as further growth beyond this level is unlikely.
- Thin red line – entry price for selling the trading instrument.
- Thick red line – target price to place Take Profit or manually secure profits, as further decline beyond this level is unlikely.
- MACD Indicator – when entering the market, it's important to be guided by overbought and oversold zones.
Important: Beginner traders in the forex market must be extremely cautious when making entry decisions. It is best to stay out of the market ahead of key fundamental releases to avoid sudden price swings. If you choose to trade during news events, always use stop-loss orders to minimize losses. Without stop-losses, you can quickly lose your entire deposit, especially if you don't use money management and trade large volumes. And remember, successful trading requires a clear trading plan—like the one I've outlined above. Making impulsive trading decisions based on the current market situation is inherently a losing strategy for intraday traders.


