


Where there's smoke, there's fire. At the start of the second week of April, a rumor spread on social media about a 90-day delay in US tariffs, causing markets to surge, only to return to their previous levels shortly after. The fake news was debunked, but it turned out that someone had access to sensitive information. Just two days later, Donald Trump himself announced the delay, and that earlier "rehearsal" became a moment of glory for the S&P 500 bulls.
The broad stock index jumped by 9.5%, marking its best percentage performance since the 2008 global financial crisis. Market capitalization surged by a record-breaking $5.1 trillion, with the biggest beneficiaries of the positive news from the White House being the tech stocks—yesterday's underdogs.
S&P 500's daily performance
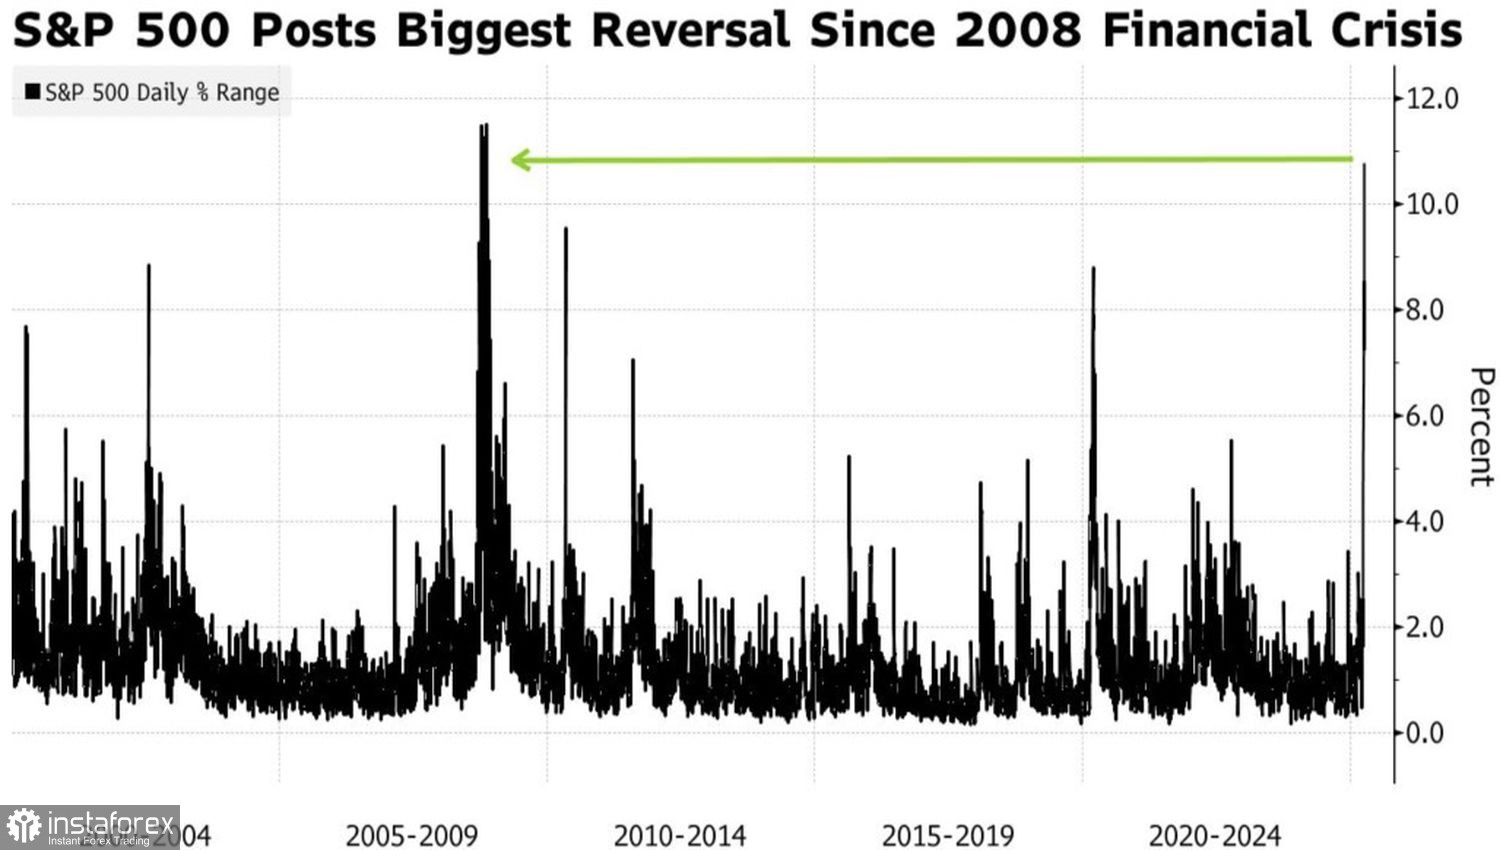
Another record was set by the volatility index (VIX), which posted the sharpest downward move in its history. No surprise there—rarely does fear on the market so suddenly give way to greed, and the fear of missing out pushed the S&P 500 up like a rocket.
A clear example of this dramatic mood shift came from Goldman Sachs, which initially raised the probability of a US recession within the next 12 months to 65%, only to retract that forecast following the White House's 90-day tariff delay. The bank reverted to its base case: no recession.
Wags say the stock market has predicted nine out of the last five recessions. A steep drop in the S&P 500 is often a harbinger of economic contraction, as seen in 2008 and 2020. But there are cases, like during Russia's 1998 debt crisis, when the index tanked without a subsequent drop in GDP.
Share of equities in US household assets
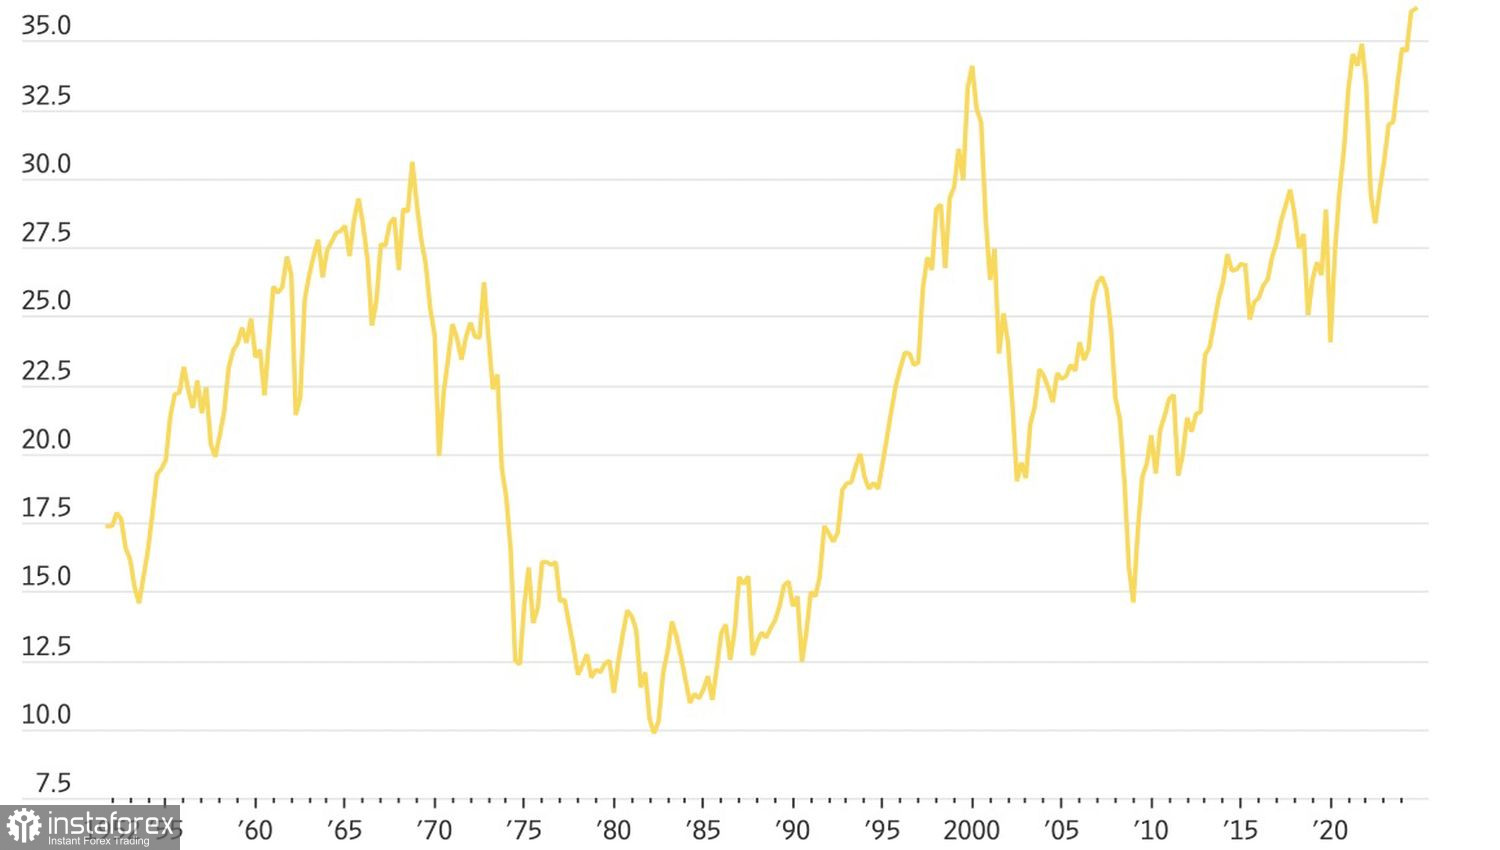
Still, the connection between the S&P 500 and the real economy is undeniable. Currently, the share of equities in American household assets has reached a record-high 36%. Market growth sparks optimism and boosts consumer spending—and vice versa. Consumer activity directly affects GDP. That's why if the broad stock index doesn't recover, a cooling of US GDP will be almost inevitable.
In reality, the trade war is far from over. The 10% universal tariff remains in place, China is facing a 125% tariff burden, and there's no guarantee that talks with other countries will succeed. They may commit to terms they never intend to fulfill—just as China did in 2018–2019. Uncertainty hasn't gone away, and the S&P 500's rapid rise may yet prove to be a "fools' rally."
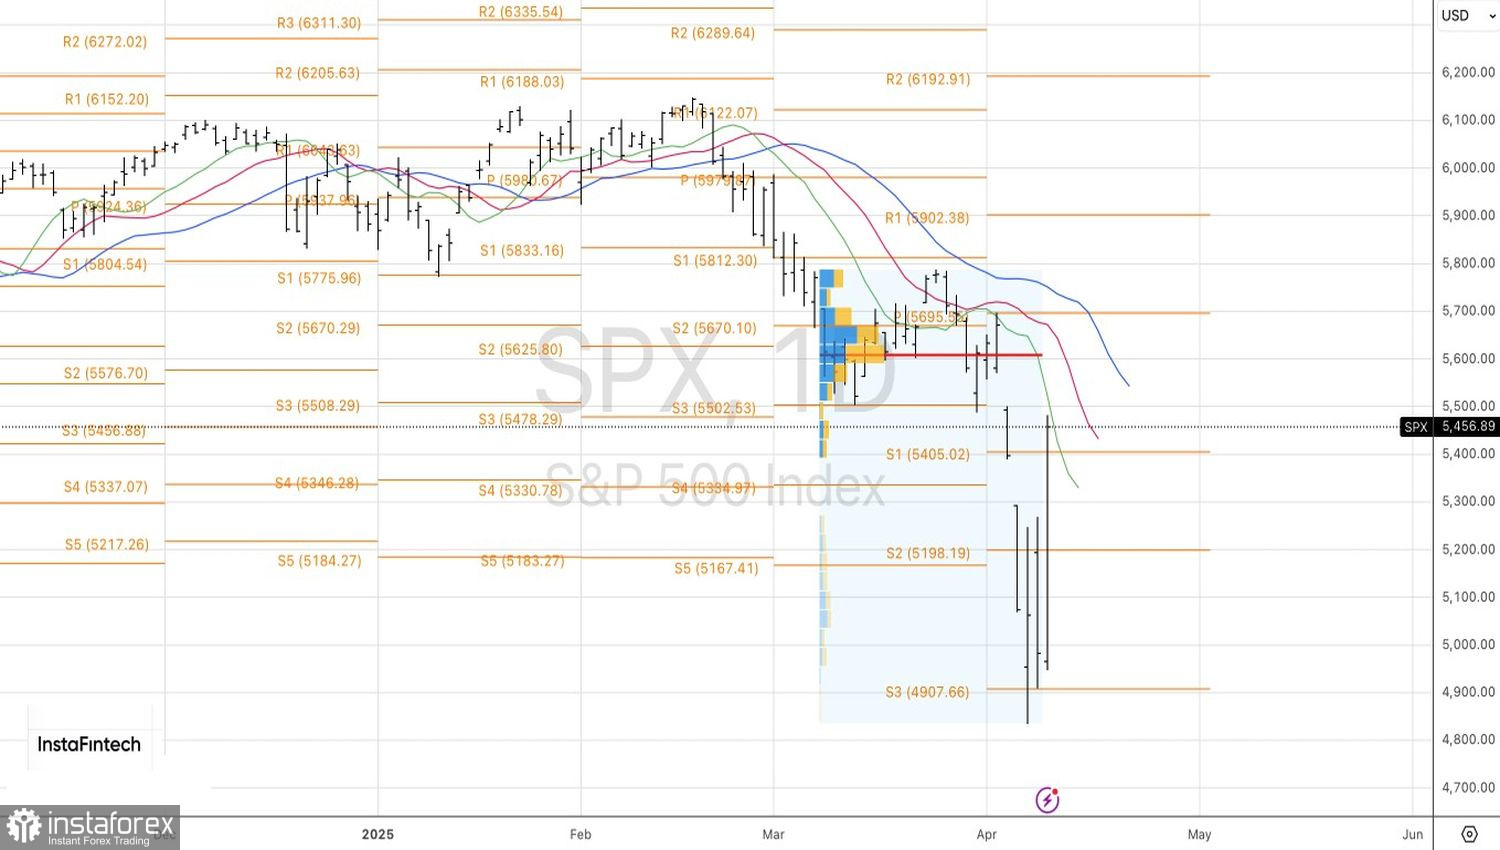
Technical outlook
On the daily chart, a large-bodied bar was formed. Long positions opened during the dip to support at 4,910 proved to be a smart move. However, a drop back below 5,405—or a rejection from resistance levels at 5,500 or 5,600—should be taken as signals to lock in profits and consider switching to short positions.


