


EUR/USD
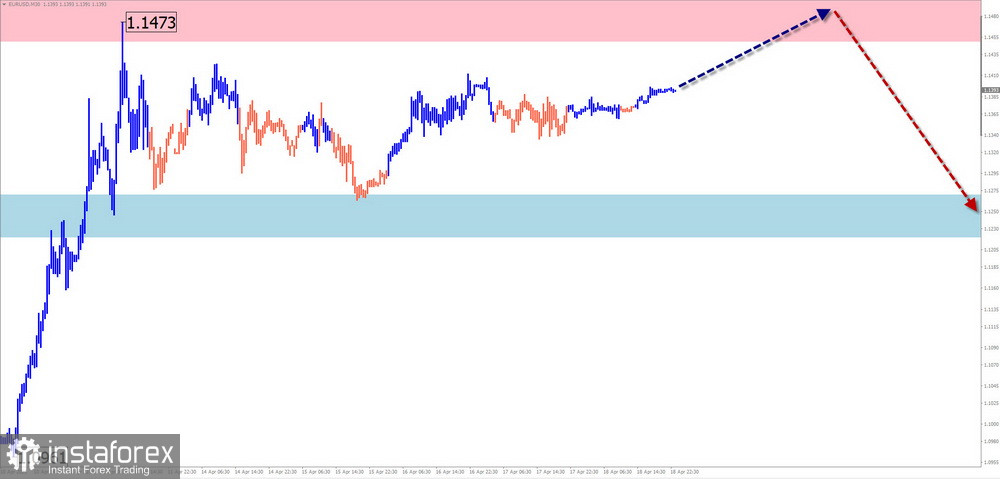
Analysis:Since February, EUR/USD has been forming an upward wave, with the final part (C) currently in progress. Recently, the pair pushed through the lower boundary of a strong potential reversal zone and has been drifting in a corrective pullback.
Forecast: A sideways movement is expected over the next few days. After a possible rebound from the resistance zone, a reversal and downward movement may follow. A temporary breakout of the upper boundary is possible before the trend changes. Volatility is likely to rise closer to the weekend.
Potential Reversal Zones:
- Resistance: 1.1450–1.1500
- Support: 1.1270–1.1220
Recommendations:
Buying: No favorable conditions for long positions.
Selling: May become the main strategy if confirmed reversal signals appear near resistance.
USD/JPY
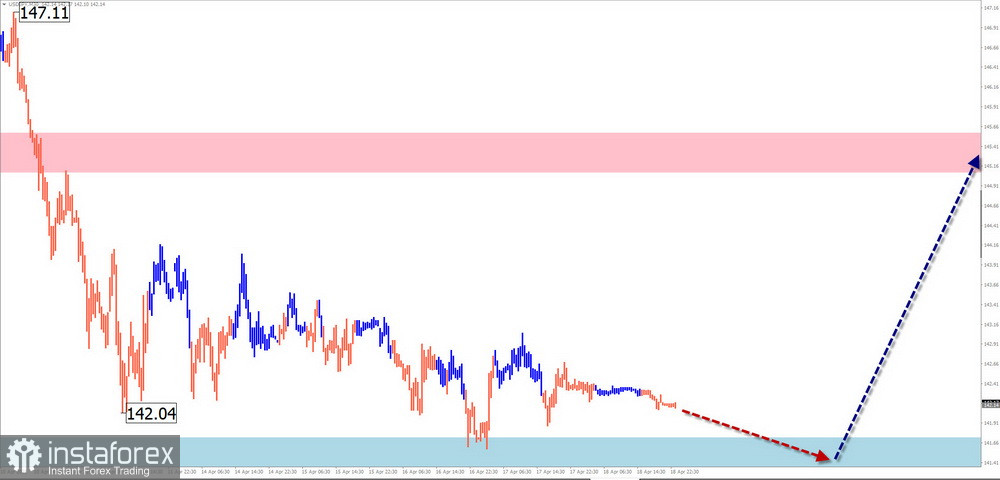
Analysis: Since late last year, the yen has been strengthening against the U.S. dollar. The latest movement began on April 9, with the pair recently breaking through multiple resistance clusters. Before continuing its ascent, the structure requires consolidation via a correction.
Forecast:Overall horizontal movement is expected this week. In the coming days, a downward bias is more likely, targeting the support zone. Toward the end of the week, growth may resume.
Potential Reversal Zones:
- Resistance: 143.80–144.30
- Support: 141.70–141.20
Recommendations:
Buying: Relevant after confirmed reversal signals appear near support.
Selling: Possible during sessions with reduced volume size; limited by support.
GBP/JPY
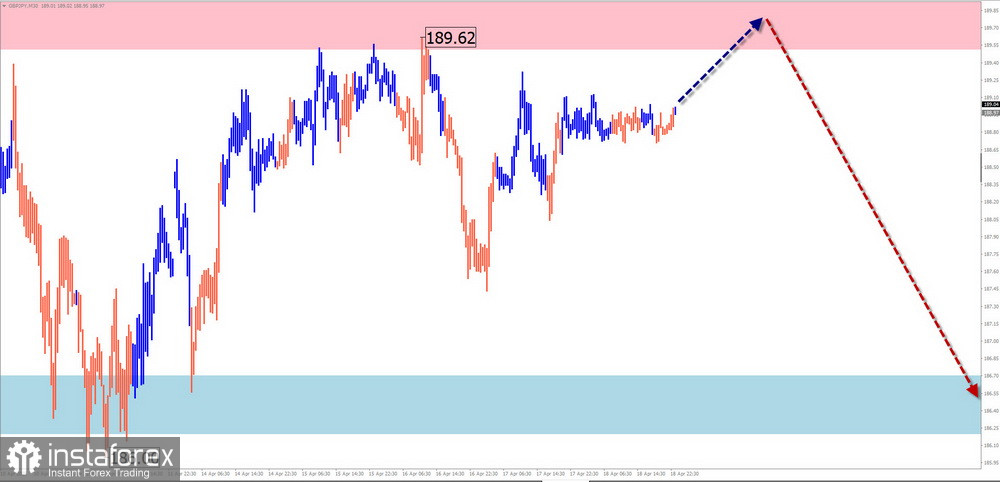
Analysis: The pair has been in a short-term downtrend since late March. Two weeks ago, it bounced off a major support level and began forming an intermediate correction, which is still incomplete.
Forecast: In the first half of the week, a brief rise and pressure on resistance is possible. A reversal and renewed downward movement are expected toward the end of the week.
Potential Reversal Zones:
- Resistance: 189.50–190.00
- Support: 186.70–186.20
Recommendations:
Selling: Risky and may result in losses.
Buying: Possible after confirmation signals appear near support.
USD/CAD
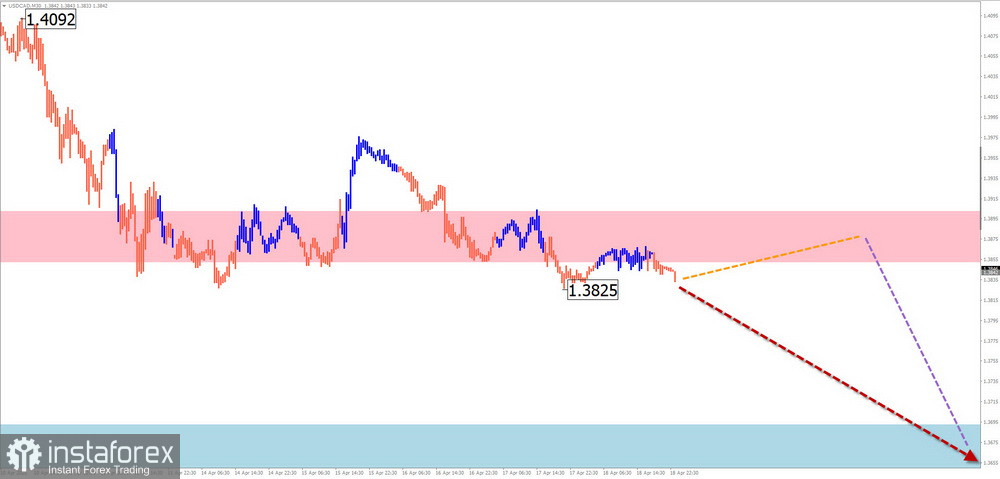
Analysis: Since February, the pair has been developing a bearish corrective zigzag. The final wave (C) remains incomplete, with a pullback forming over the last two weeks. The calculated support zone lies near the upper edge of a large weekly reversal area.
Forecast: Continued downward movement is expected within the corridor between nearby reversal zones. A brief upward correction may occur early in the week, with a renewed decline likely by the end.
Potential Reversal Zones:
- Resistance: 1.3880–1.3930
- Support: 1.3670–1.3620
Recommendations:
Buying: Low potential; could lead to losses.
Selling: Relevant after confirmed reversal signals appear near resistance.
NZD/USD
Analysis: The long-term downtrend since last summer has been replaced by a reversal structure since April 9, now forming wave (C). The pair has reached the upper boundary of a strong weekly reversal zone.
Forecast: Early in the week, resistance pressure may persist, with a possible brief breakout. A trend reversal and decline are expected to follow.
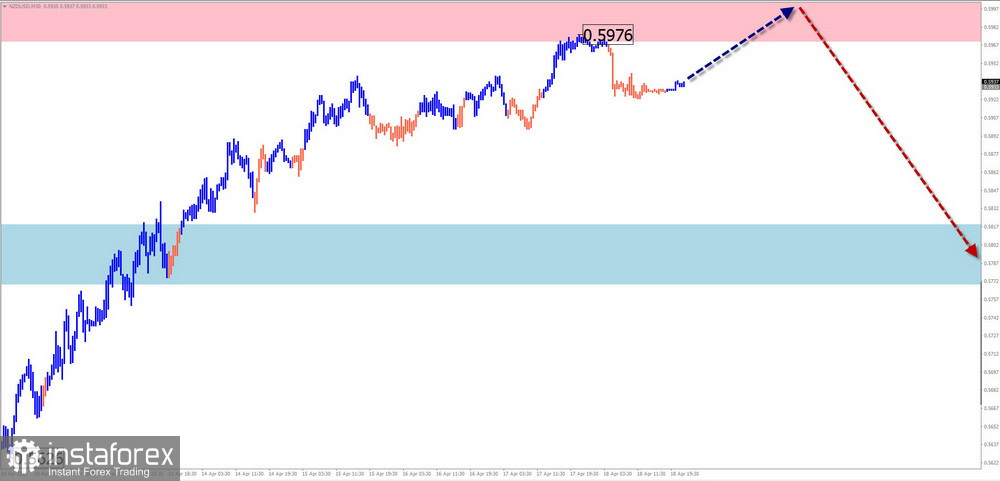
Potential Reversal Zones:
- Resistance: 0.5970–0.6020
- Support: 0.5820–0.5770
Recommendations:
Buying: Lacks potential and may be risky.
Selling: Recommended after confirmation signals near resistance.
Gold
Analysis: The bullish impulse that started in September has extended. After breaching another resistance level, gold has entered a sideways drift near the 3,400 level. Given the impulsive nature of the wave, a flat correction may form next.
Forecast: Sideways movement is expected early in the week, possibly testing resistance. A reversal and decline may begin in the second half. The expected weekly low is marked by the support zone.
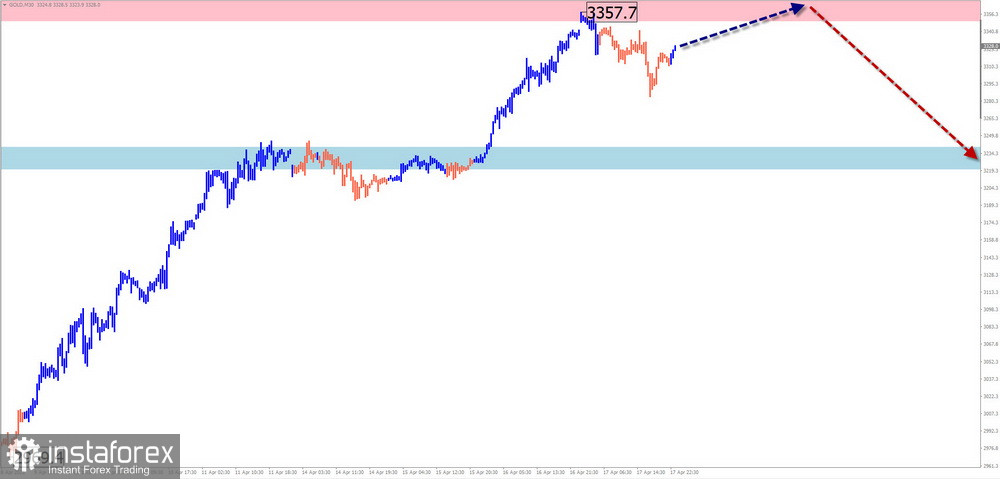
Potential Reversal Zones:
- Resistance: 3350.0–3370.0
- Support: 3240.0–3220.0
Recommendations:
Buying: Low potential; may be risky.
Selling: Premature until clear reversal signals appear on your trading systems.
Note: In simplified wave analysis (SWA), all waves are composed of 3 parts (A-B-C). Each time frame focuses on the last incomplete wave. Dotted lines indicate expected movements.
Caution: Wave algorithms do not account for time duration of movements!


