


The EUR/USD currency pair found a reason to resume its decline on Monday. As mentioned before, the U.S. dollar's position looks very shaky. It had risen for over a month, but this growth was much weaker than the preceding fall. And although the dollar was technically climbing, who can confidently say this trend will continue? After all, the "Trump factor" hasn't disappeared. Yes, trade tensions have eased over the past month, which probably explains the dollar's strengthening.
Meanwhile, the European Central Bank has continued easing monetary policy, and the Federal Reserve is patiently waiting for inflation to accelerate, refusing to give in to either Trump or the markets. In truth, there were several reasons for the dollar's rise in recent weeks. The fact that it only strengthened marginally highlights the market's skepticism towards the U.S. dollar.
On Monday, the most notable news was Moody's downgrade of the U.S. credit rating. Moody's, one of the three globally recognized rating agencies, was the last to cut the rating. America's credit rating is now AA1—still very high, just one notch below the top-tier AAA.
The issue isn't the new rating but the timing: It happened during Donald Trump's second term. While Trump continues to tout a "great future" in every interview, that future may not arrive until after he leaves office. That doesn't bother him—he blames Biden for the current crisis and economic slump and will, of course, credit himself for any future boom.
Moody's explained its decision by citing the sharp rise in national debt over the past 10 years and increasing debt servicing costs. Interest on government loans doesn't rise arbitrarily—it increases when lenders are hesitant. Consequently, the U.S. government is forced to raise rates, putting more pressure on the federal budget. Ironically, Trump, who aimed to fight the budget deficit and public debt, has worsened both. Moody's emphasized that few other sovereign nations have interest rates on debt as high as the U.S., which factored into the downgrade.
A credit rating isn't just a formal label—it reflects a nation's financial health and stability.
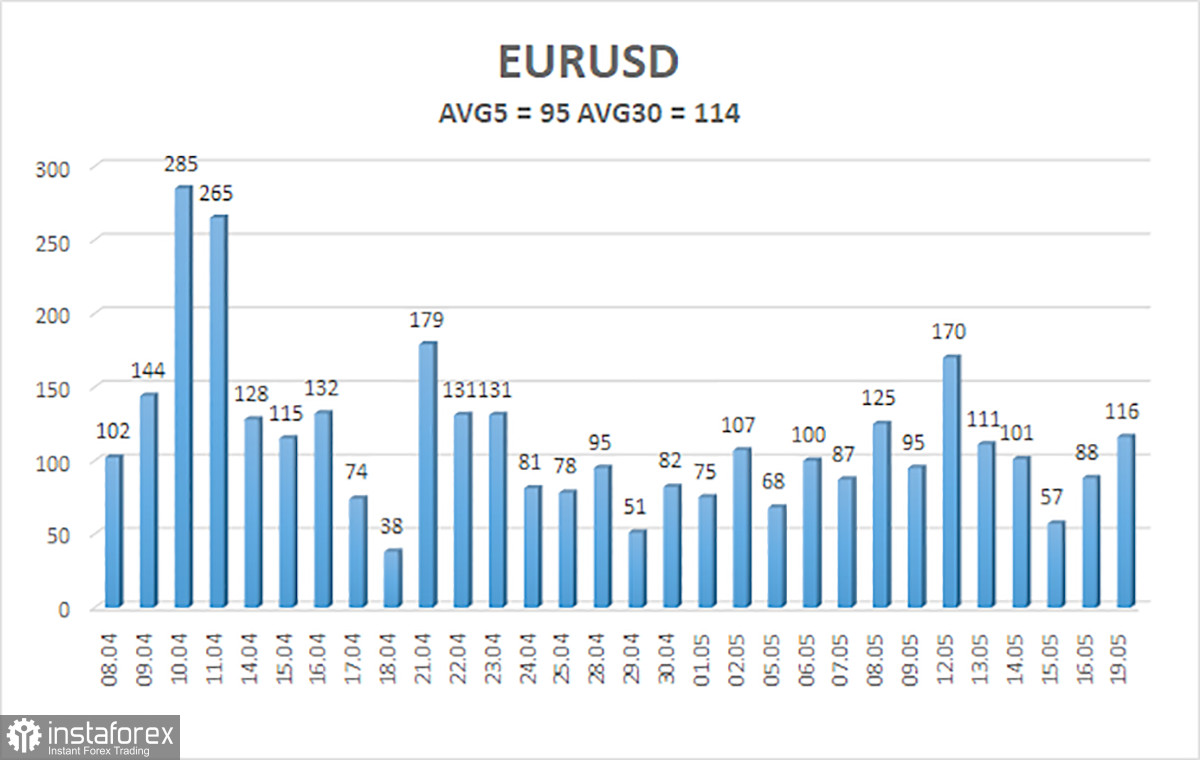
The average volatility of the EUR/USD pair over the last five trading days as of May 20 is 95 pips, which is considered high. We expect the pair to move between 1.1143 and 1.1333 on Tuesday. The long-term regression channel is still upward, indicating a short-term bullish trend. The CCI indicator entered the oversold zone, which, within a bullish trend, signals trend resumption. Shortly afterward, a bullish divergence formed, triggering a new wave of upward movement.
Nearest Support Levels:
S1: 1.1230
S2: 1.1108
S3: 1.0986
Nearest Resistance Levels:
R1: 1.1353
R2: 1.1475
R3: 1.1597
Trading Recommendations:
The EUR/USD pair is attempting to resume its uptrend. Over the past few months, we have consistently stated that we expect a medium-term decline in the euro, and that view remains unchanged. Aside from Donald Trump, the U.S. dollar still has no reason to fall. However, since Trump has recently leaned toward trade de-escalation, the trade war factor currently supports the dollar, which may eventually return to its base level around 1.03.
Given the current context, long positions are not considered relevant. Short positions remain preferable if the price is below the moving average, with targets at 1.1108 and 1.0986.
Explanation of Illustrations:
Linear Regression Channels help determine the current trend. If both channels are aligned, it indicates a strong trend.
Moving Average Line (settings: 20,0, smoothed) defines the short-term trend and guides the trading direction.
Murray Levels act as target levels for movements and corrections.
Volatility Levels (red lines) represent the likely price range for the pair over the next 24 hours based on current volatility readings.
CCI Indicator: If it enters the oversold region (below -250) or overbought region (above +250), it signals an impending trend reversal in the opposite direction.


