


EUR/USD 5-Minute Analysis
The EUR/USD currency pair plunged sharply overnight on Thursday but posted a threefold stronger rally throughout the day. The overnight movement was triggered by a single event: the U.S. Court of International Trade annulled nearly all tariffs imposed by Donald Trump, declaring them illegal, citing "abuse of power," and siding with the lawsuit filed by 12 Democratic states and several private business owners. Naturally, Trump disagreed with the decision, announced he would file an appeal, and intended to take the case to the Supreme Court.
Why did the dollar rally overnight? Because if tariffs are canceled, the trade war — which fueled most of the dollar's collapse in recent months — would presumably be over.
Why did the dollar crash in the second half of the day? Because the market continues to interpret most news negatively for the dollar, doesn't trust Donald Trump, doesn't believe in economic growth under a Republican administration, and simply distrusts the current government.
Moreover, since Trump intends to fight for his tariffs, there's a high probability that he will overturn the International Trade Court's decision. Thus, no real de-escalation of the trade war has occurred yet. The court has suspended the tariffs, but that doesn't change anything unless Trump abandons the idea of reinstating them — which he won't.
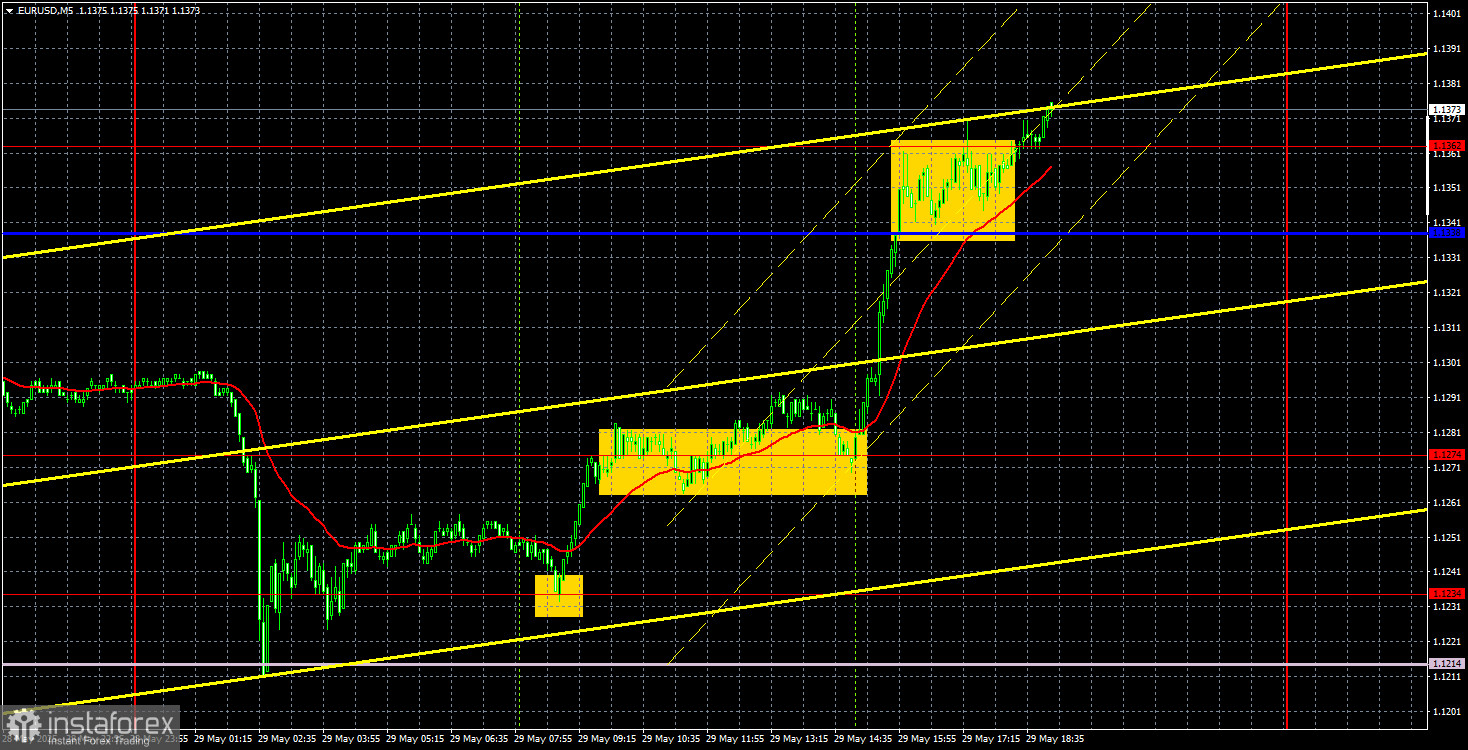
On the 5-minute timeframe, Thursday's trading signals were excellent. Early in the European session, the price rebounded from the 1.1234 level and rallied all day. By the end of the day, it exceeded the 1.1362 level, where long positions could have been closed. No sell signals were generated during the day. The minimum profit that could have been achieved was approximately 120 pips.
COT Report
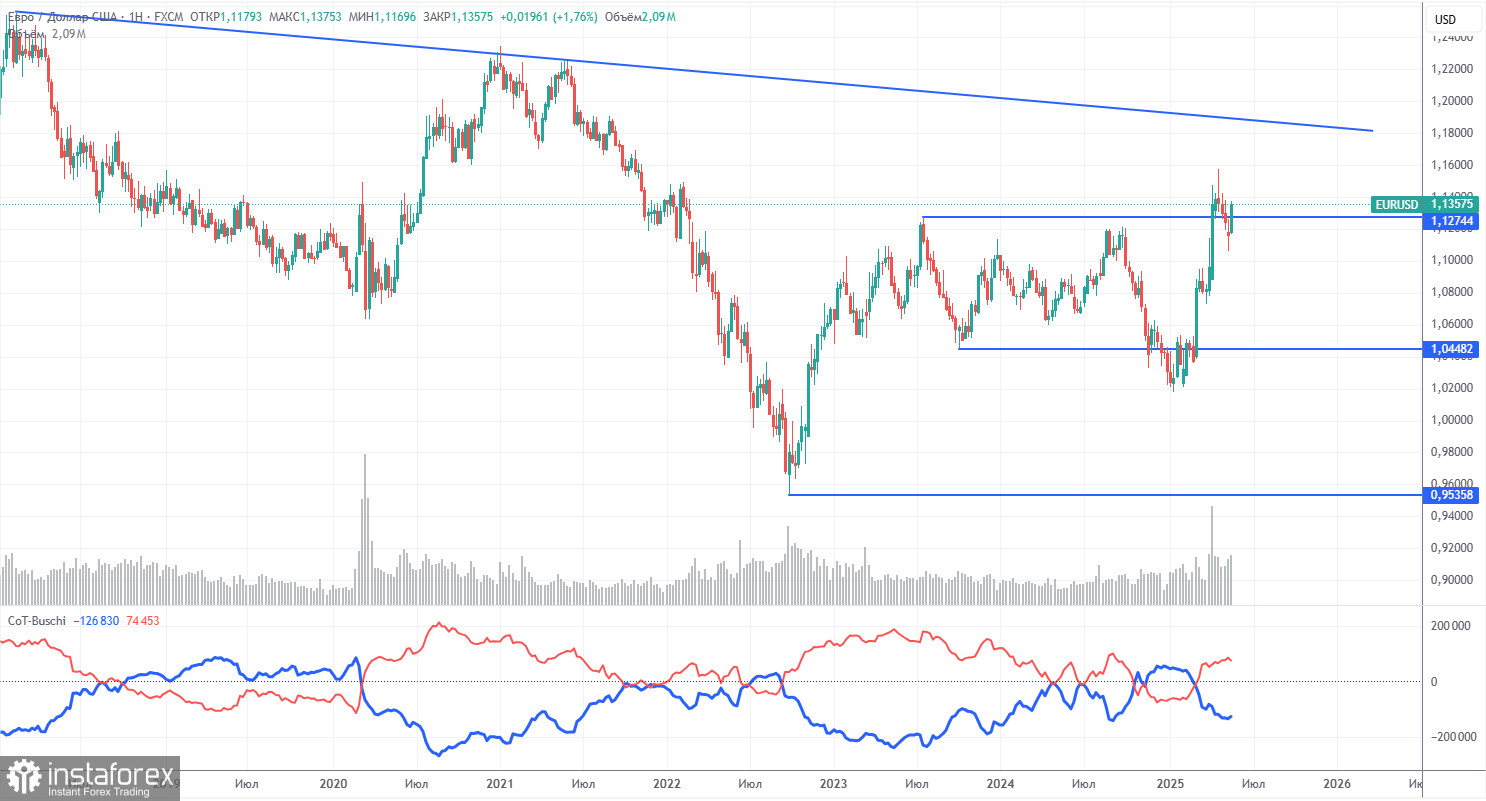
The latest COT report is dated May 20. The chart above clearly shows that the net position of non-commercial traders remained bullish for a long time. Bears barely gained dominance at the end of 2024 but quickly lost it. Since Trump took office, the dollar's value has been declining significantly. We cannot confidently say with 100% certainty that the dollar's decline will continue, but current global developments suggest that outcome.
No fundamental factors support the euro's strength; however, one significant factor contributes to the dollar's weakness. The long-term downtrend persists, though what does the trend even mean right now? The dollar could rise again once Trump ends his trade wars, but will he?
The red and blue lines have crossed again, indicating a renewed bullish sentiment in the market. During the latest reporting week, the number of long positions among "Non-commercial" traders decreased by 3,500, while short positions increased by 6,800. As a result, the net position fell by 10,300. However, the COT reports are released with a one-week delay. The market is once again actively buying now.
EUR/USD 1-Hour Analysis
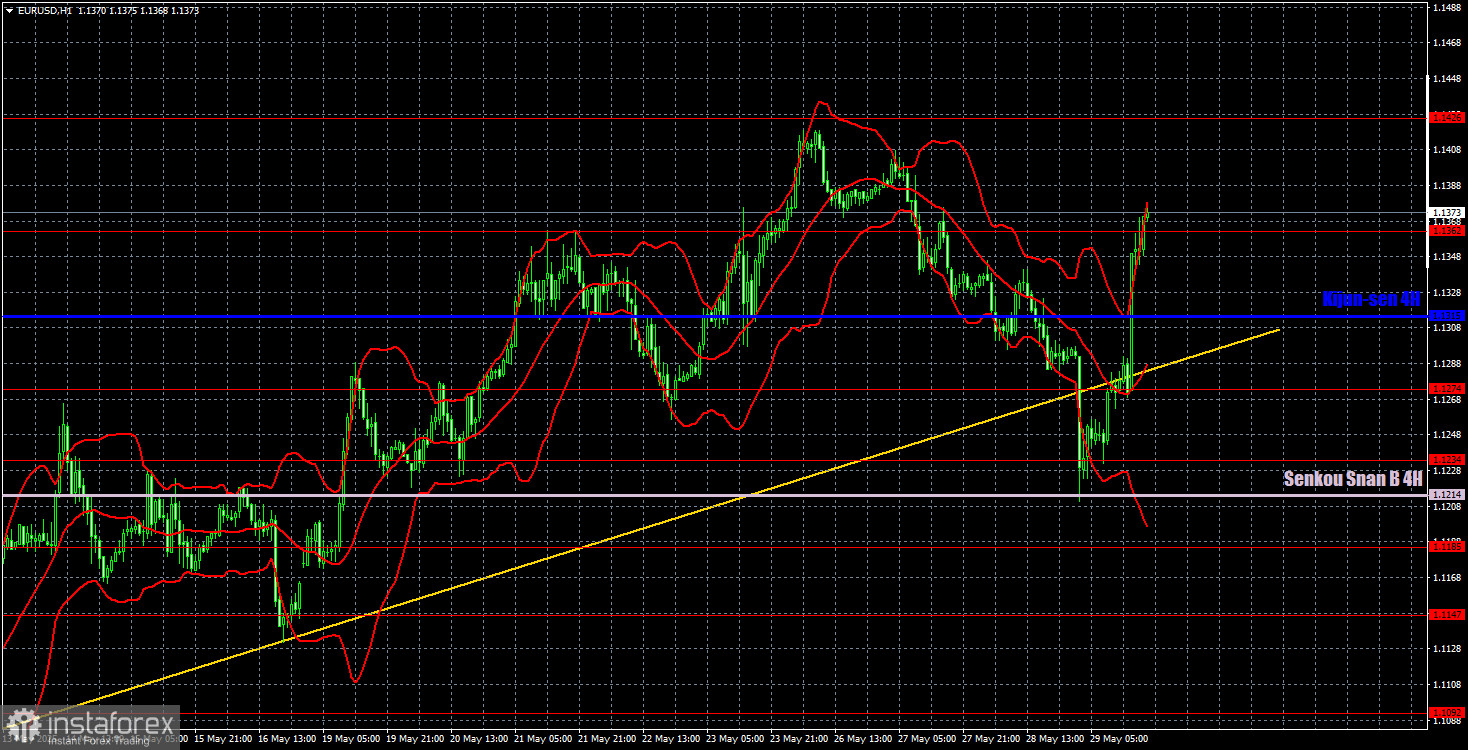
On the hourly timeframe, the EUR/USD pair maintains a local upward trend, which is part of a 4-month overall uptrend. The dollar's prospects still heavily depend on developments related to the global trade war. If trade agreements are signed and tariffs are reduced, the U.S. dollar might start to recover. However, for now, no peace agreements are in sight. Trump continues to make strange decisions and shocking statements, and the market expects the worst, simply not trusting Trump. Even the court-forced tariff cancellation didn't save the U.S. dollar.
For May 30, we identify the following levels for trading: 1.0823, 1.0886, 1.0949, 1.1006, 1.1092, 1.1147, 1.1185, 1.1234, 1.1274, 1.1362, 1.1426, 1.1534, 1.1607, along with the Senkou Span B line (1.1214) and the Kijun-sen line (1.1315). The Ichimoku indicator lines can shift during the day, so they should be considered when determining trading signals. Don't forget to place a Stop Loss at breakeven once the price moves 15 pips in the correct direction — this helps avoid potential losses if a signal turns out to be false.
In the Eurozone, retail sales and inflation data from Germany are scheduled for release. While these reports are noteworthy, they are not the most critical. In the U.S., we expect the Personal Consumption Expenditures (PCE) price index, personal income and spending data, and the University of Michigan Consumer Sentiment Index. Again, these are not the most crucial reports either.
Illustration Explanations:
- Support and resistance price levels – thick red lines where movement may end. They are not trading signal sources.
- Kijun-sen and Senkou Span B lines—These are strong Ichimoku indicator lines transferred to the hourly timeframe from the 4-hour one.
- Extremum levels – thin red lines where the price has previously rebounded. These act as trading signal sources.
- Yellow lines – trend lines, trend channels, and other technical patterns.
- COT Indicator 1 on the charts – the size of the net position for each category of traders.


