


















Gold Technical Analysis
Daily Chart
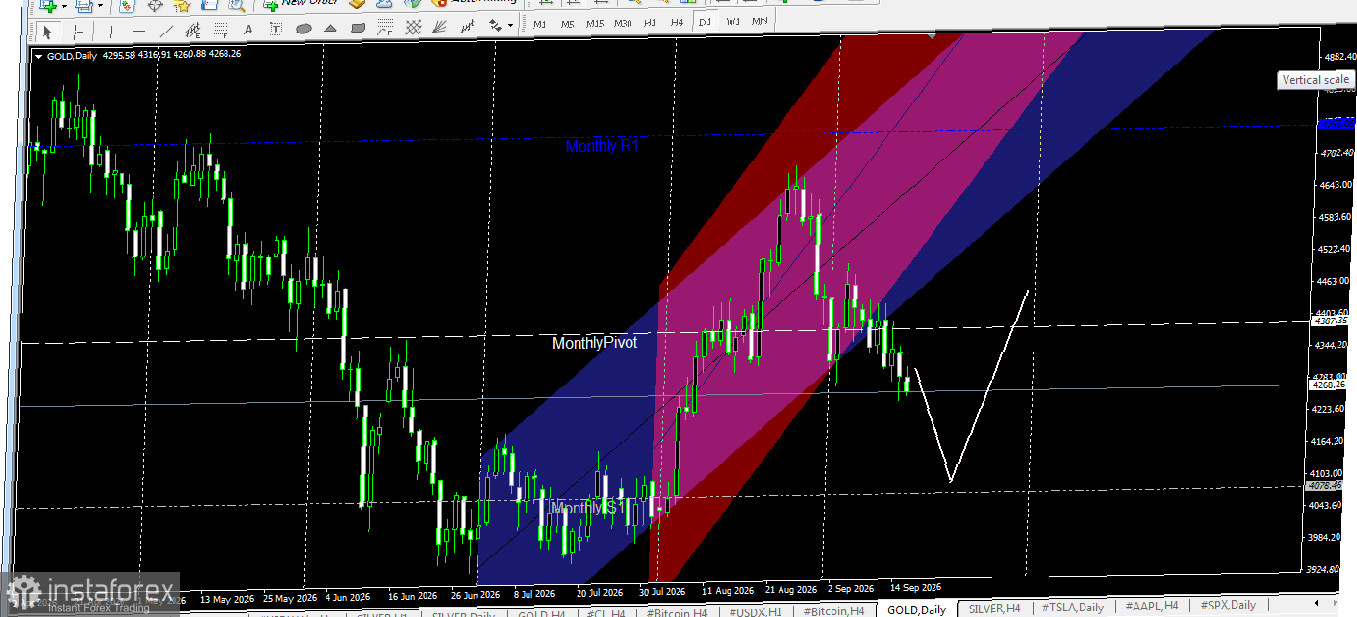
I believe the price of gold is beginning a downward trend. Let us examine the technical analysis to identify the reasons behind this forecast.
At the beginning of this month, gold traded within ascending price channels—marked in blue and red—that represented the trend over the previous two months of trading.
Although the price found support at the monthly pivot level, it encountered resistance at the channels' midlines and began to decline.
The price successfully broke below both the price channels and the monthly pivot level; consequently, it is likely to continue falling toward the monthly support level at 4078.46.
This level will determine whether gold resumes its upward movement or continues its decline toward the annual pivot level at 3830.00.
This brings us to the weekly gold chart.
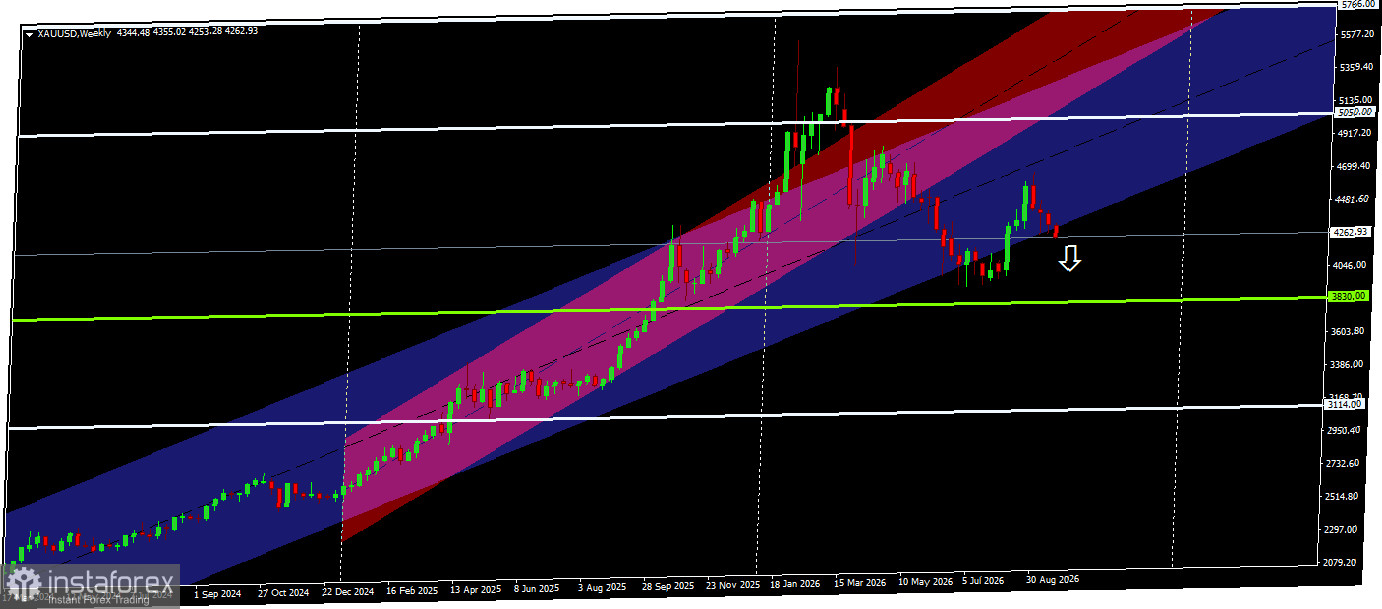
On the weekly chart, we observe the price breaking below the channels that represented the trend over the past two years—marking the second time such a break has occurred.
There was a previous attempt several weeks ago that ended with the price finding support at the annual pivot level of 3830.
Will gold repeat this pattern by reaching that zone and then rebounding to resume its upward trend?
We are left with two scenarios for gold's price movement:
The bearish scenario remains valid as long as gold trades below the 4387 level.
In this case, the price could reach the support level of 4078.46, followed by the 3830 level seen on the weekly chart. The bullish scenario remains valid as long as the price of gold trades above the 4387 level this month.
I wish you success in selecting your market entry and exit points; however, my trading advice is to focus on the 4387 level—looking for selling opportunities below it and buying opportunities above it.
The 4078 level also presents a buying opportunity, but only following the formation of bullish price action.


