


















Gold Technical Analysis
It appears that the price of gold is heading for further decline; let us examine the chart indicators that lead to this forecast.
Daily Chart
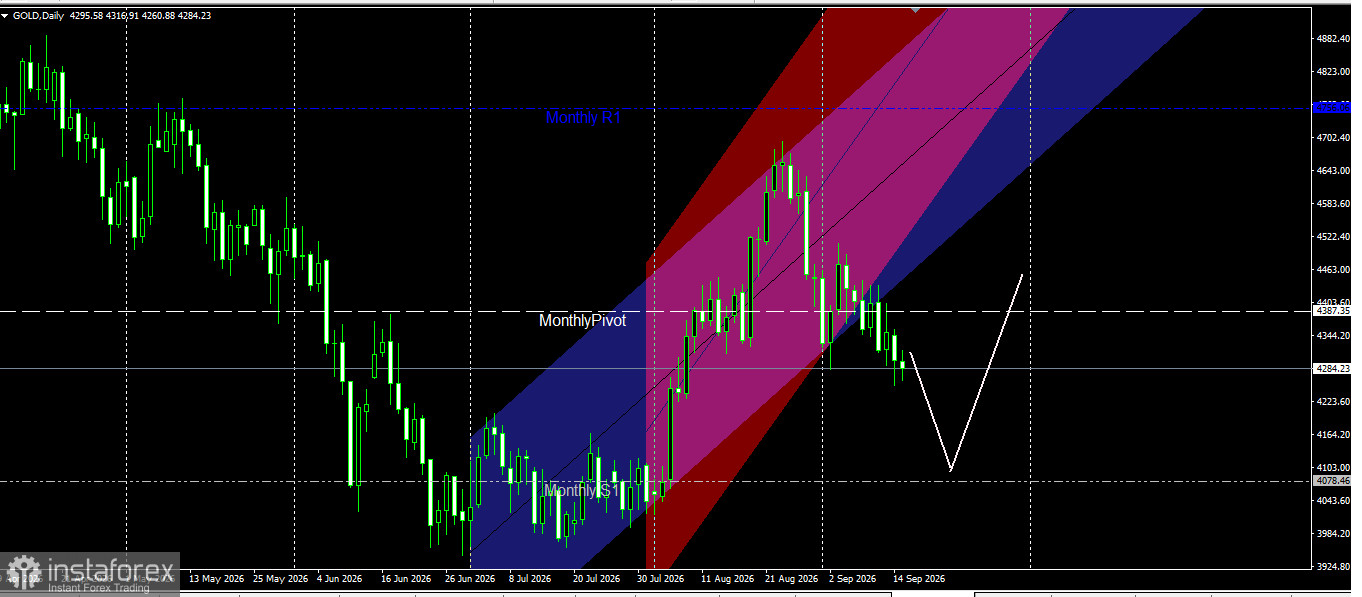
On the weekly chart, the gold price has successfully broken below the rising price channels that defined the trend over the previous two years.
However, a similar breakout occurred previously, and the annual pivot zone at 3830 succeeded in pushing the price back up.
Will this price action repeat itself, with gold finding support at the 3830 level? This is what needs to be monitored.
The trading recommendation is to focus on selling opportunities as long as the price trades below the 4387.00 and 4078.00 levels.
Buying is an option if bullish price action emerges at the 4078.00 support level.
Buying is also possible above the 4387 level.


