


Trend Analysis
This week, from the 1.3446 level (closing of the last weekly candle), the price may continue to decline toward the target of 1.3256 — the 23.6% pullback level (red dashed line). Upon testing this level, the price may start moving upward toward the 13 EMA at 1.3317 (thin yellow line).
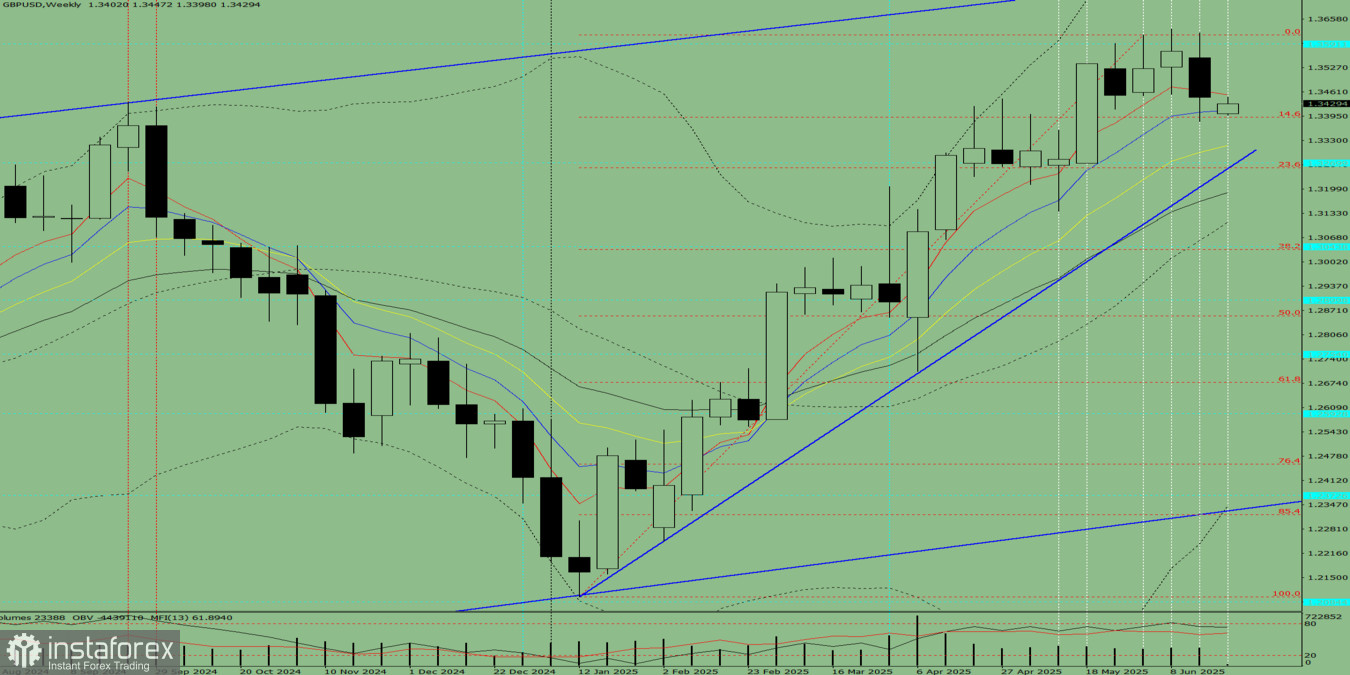
Figure 1 (Weekly Chart)
Comprehensive Analysis:
- Indicator analysis – downward
- Fibonacci levels – downward
- Volume – downward
- Candlestick analysis – downward
- Trend analysis – downward
- Bollinger Bands – downward
- Monthly chart – downward
Conclusion Based on Comprehensive Analysis:
A downward movement is expected.
Overall Forecast for the Weekly GBP/USD Candle:
The price is likely to follow a downward trend throughout the week, forming a weekly black (bearish) candle without an upper shadow (Monday – down), and with a lower shadow (Friday – up).
Alternative Scenario:
From the 1.3446 level (closing of the last weekly candle), the price may continue to decline toward the 13 EMA at 1.3317 (thin yellow line). Upon reaching this line, a rebound to the upside is possible with a target of 1.3392 — the 14.6% pullback level (red dashed line).


