


EUR/USD 5-Minute Analysis
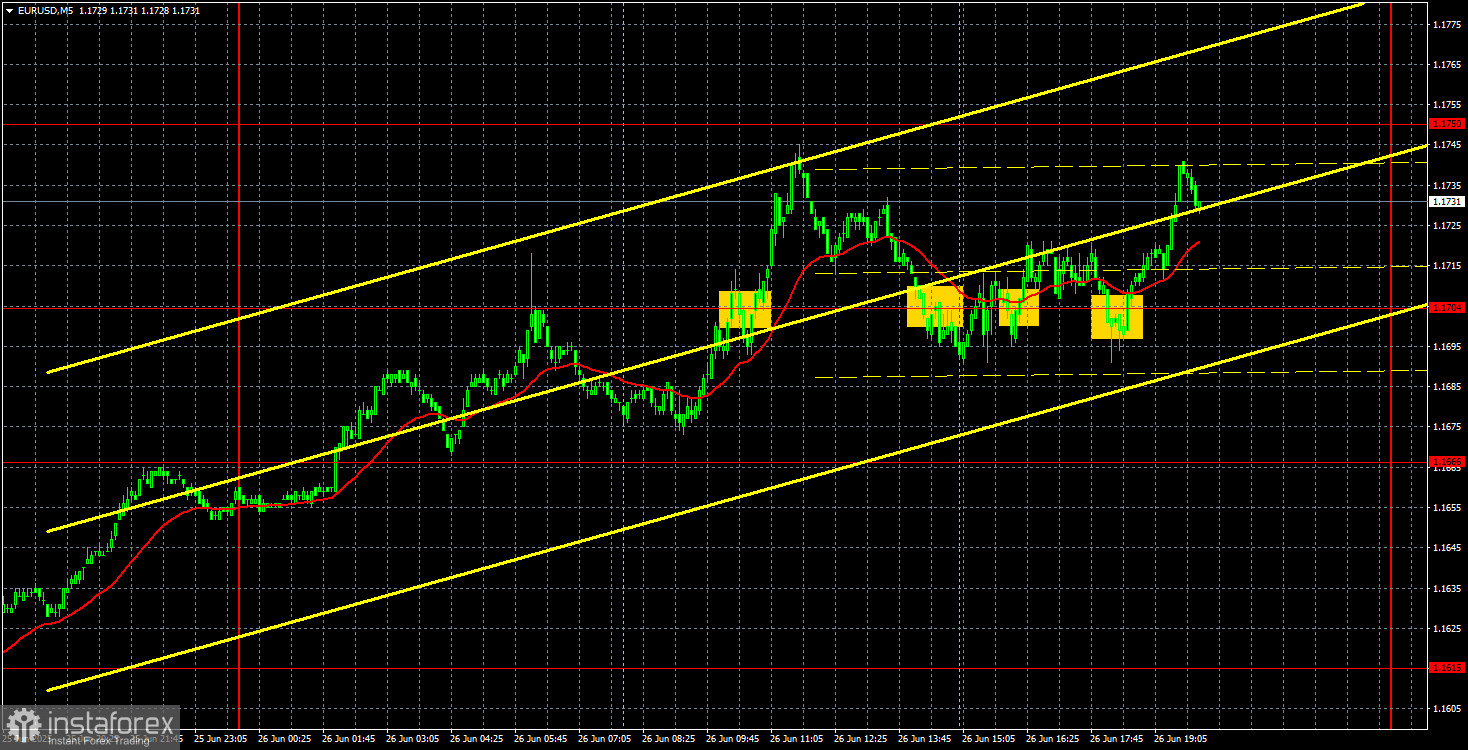
The EUR/USD currency pair continued its strong upward movement throughout Thursday. A new wave of growth for the European currency began on Wednesday evening and continued into Thursday night. Therefore, the current movement can be considered "one-sided." At first glance, such a movement may seem like a dream for traders. However, in reality, such moves are rare in the currency market. Let us recall one of the key trading rules — buy on pullbacks and corrections. But where can one buy if there are no pullbacks or corrections? We believe that the moves seen this week cannot be considered favorable for traders. It should be understood that the market has been highly emotional for five months, so at certain times (like this week), technical analysis simply doesn't work. Traders are paying no attention to levels or technical indicators. They are simply fleeing from the dollar en masse.
Yesterday, Donald Trump announced his readiness to name the next Fed Chair. Naturally, he did not reveal a name or even the list of candidates to maintain intrigue. However, the market did not welcome the news about a new Fed Chair a year before Jerome Powell's term expires. We do not believe this news is the sole reason behind the new collapse of the U.S. dollar, but it is yet another headline from overseas pointing to deep structural problems in the country under Trump.
In the 5-minute timeframe, the constant upward movement on the hourly chart appears different. The price predominantly rises but corrects not from levels but randomly. Moreover, these levels are about three years old and may have become outdated. Once again, the euro has reached its highest value in three years. And it would never be this high if Trump were not president. Thus, several trading signals were generated on Thursday, but they were unsatisfactory. We advise traders to be more cautious than usual and only trade on "100% signals."
COT Report
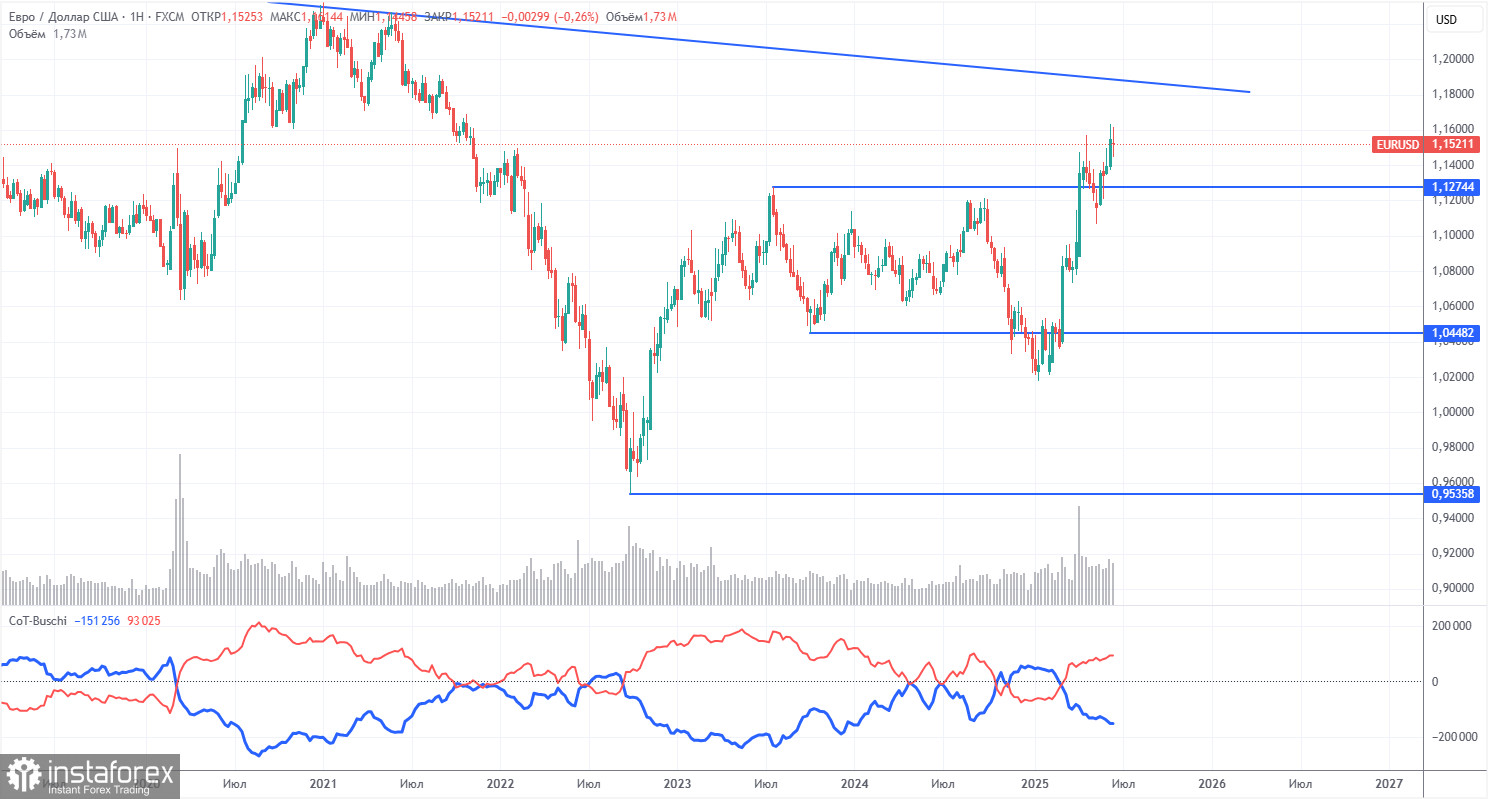
The most recent COT report is dated June 10. The chart above shows that the net position of non-commercial traders has long been bullish. Bears gained the upper hand briefly at the end of 2024 but quickly lost it. Since Trump assumed the presidency, only the dollar has been falling. We cannot say with 100% certainty that the dollar will continue to fall, but current global events suggest this scenario is likely.
We still see no fundamental reasons for the euro to strengthen. However, there is a powerful fundamental reason for the dollar to decline. The global downtrend remains intact—but what relevance does the past 16 years of price action have now? Once Trump ends his trade wars, the dollar could begin to rise. But will Trump ever end them? And when?
The red and blue lines have crossed again, signaling a renewed bullish trend. During the latest reporting week, the number of longs held by the "Non-commercial" group increased by 6,000, and the number of shorts decreased by 4,300. As a result, the net position rose by 10,300 over the week.
EUR/USD 1-Hour Analysis
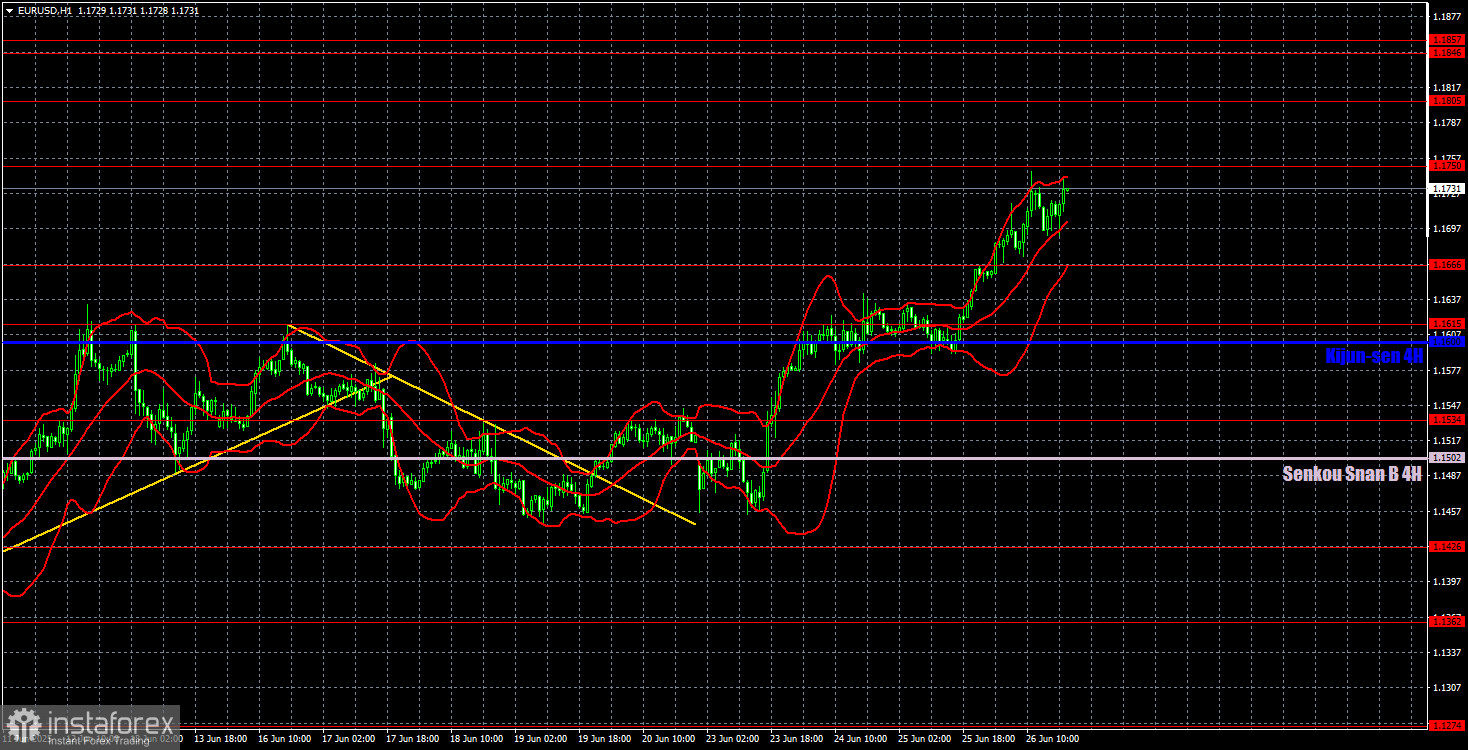
On the hourly timeframe, EUR/USD continues forming a new upward trend, with almost no retracements. A flood of information from the U.S. continues to hit the market, effectively forcing traders to dump the dollar. And this information now goes beyond the economy — it concerns the future of the United States. The dollar has been falling for five consecutive months, having already depreciated by 1,500 pips during that time. We can't even recall the last time the dollar fell this sharply.
For June 27, we highlight the following levels for trading: 1.1092, 1.1147, 1.1185, 1.1234, 1.1274, 1.1362, 1.1426, 1.1534, 1.1615, 1.1666, 1.1750, 1.1805, 1.1846–1.1857, as well as the Senkou Span B line (1.1502) and the Kijun-sen line (1.1600). The Ichimoku indicator lines may shift during the day, which should be considered when determining trading signals. Don't forget to set a breakeven Stop Loss order if the price moves 15 pips in the correct direction — this will protect against potential losses if the signal turns out to be false.
On Friday, no important or even secondary events are scheduled in the Eurozone. In the U.S., among the more notable reports, we can highlight only the core Personal Consumption Expenditures (PCE) index and the University of Michigan Consumer Sentiment Index.
Illustration Explanations:
- Support and resistance price levels – thick red lines where movement may end. They are not trading signal sources.
- Kijun-sen and Senkou Span B lines—These are strong Ichimoku indicator lines transferred to the hourly timeframe from the 4-hour one.
- Extremum levels – thin red lines where the price has previously rebounded. These act as trading signal sources.
- Yellow lines – trend lines, trend channels, and other technical patterns.
- COT Indicator 1 on the charts – the size of the net position for each category of traders.


