


Trend Analysis (Fig. 1):
On Friday, from the 1.3723 level (yesterday's daily candle close), the market may continue rising toward 1.3769 – the upper fractal (yellow dashed line). Upon testing this level, a downward movement is possible toward 1.3710 – the 14.6% retracement level (yellow dashed line).
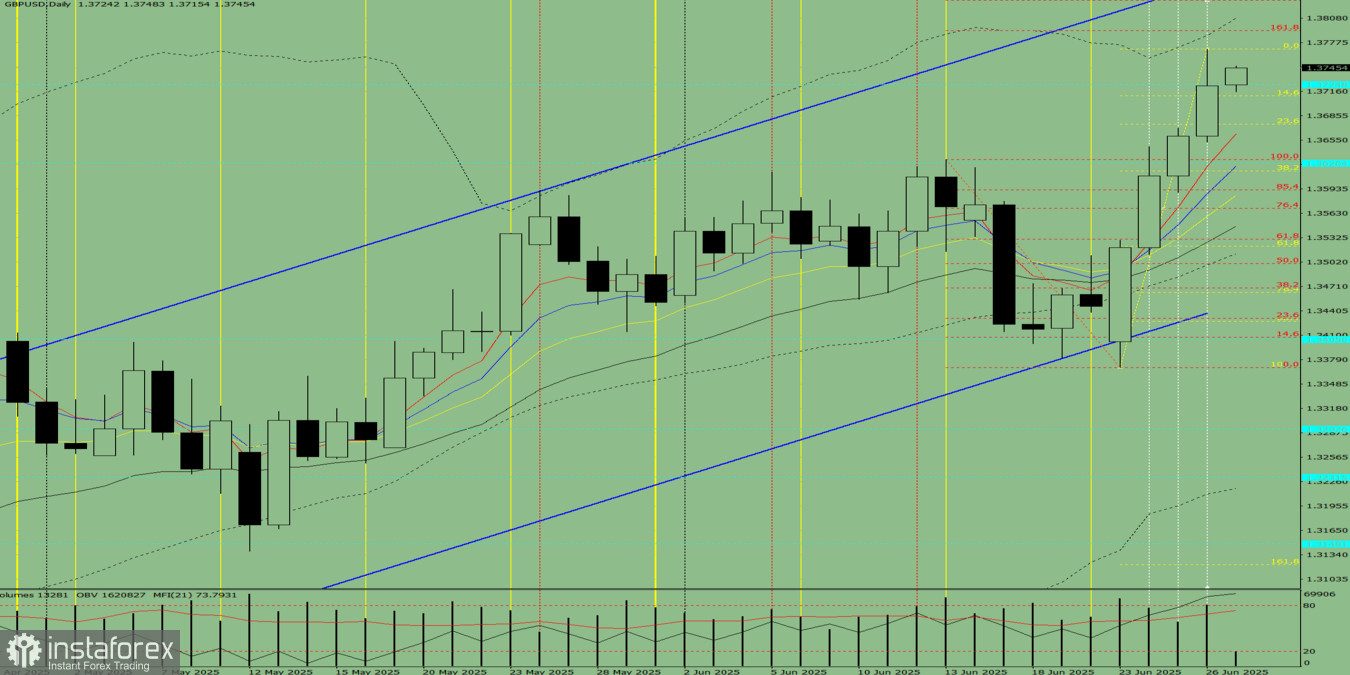
Fig. 1 (Daily Chart)
Comprehensive Analysis:
- Indicator analysis – upward
- Fibonacci levels – upward
- Volume – upward
- Candlestick analysis – upward
- Trend analysis – upward
- Bollinger Bands – upward
- Weekly chart – upward
Overall conclusion: bullish trend
Alternative Scenario: From the 1.3723 level (yesterday's daily candle close), the price may continue upward toward 1.3769 – upper fractal (yellow dashed line). If this level is tested, the upward movement may extend toward the 1.3792 target – 161.8% level (red dashed line).


