


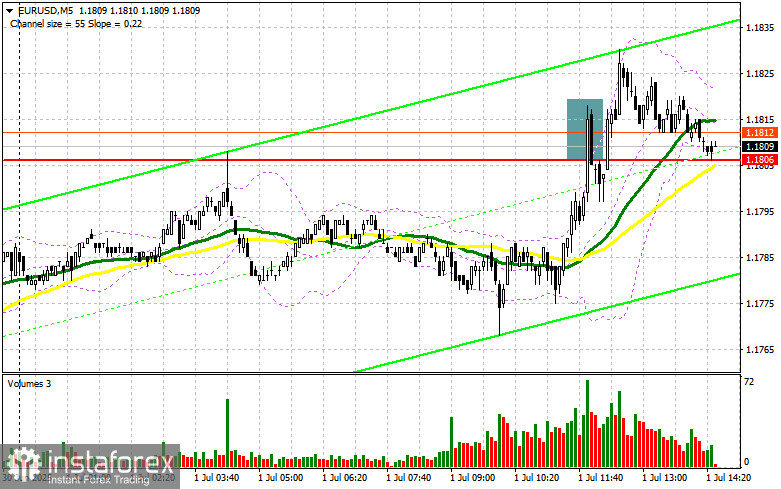
In my morning forecast, I highlighted the 1.1806 level as a reference point for making trading decisions. Let's take a look at the 5-minute chart and examine what happened there. A rise followed by a false breakout around 1.1806 provided a selling opportunity for the euro, but no significant downward movement occurred. The technical outlook has been revised for the second half of the day.
To open long positions on EUR/USD:
Fairly strong data on the Eurozone Manufacturing PMI, which came close to the 50-point mark, triggered euro buying in the first half of the day. In the second half, pressure on the EUR/USD pair may return, but only if the U.S. ISM Manufacturing PMI for June shows solid results. In addition, Federal Reserve Chair Jerome Powell is expected to remind traders that the Fed does not intend to lower interest rates prematurely. If neither of these factors materializes, the pair is likely to continue rising.
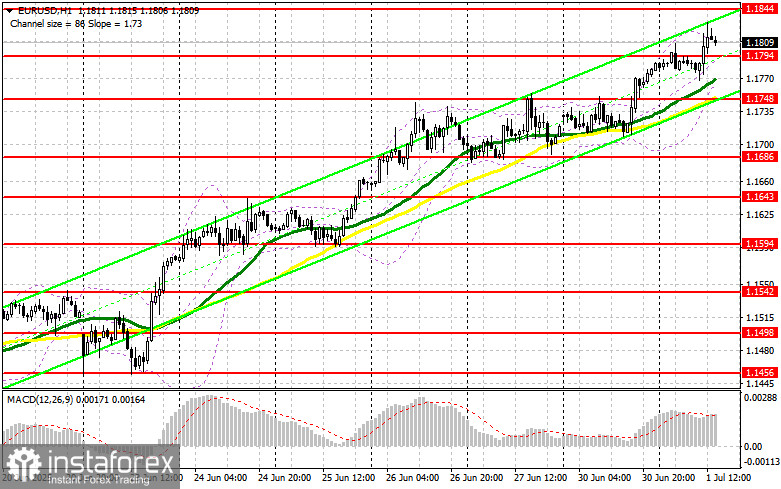
In the event of a pullback following U.S. data, I will consider long positions near the newly formed support at 1.1794, based on the first half of the day. A false breakout at this level would serve as a buy signal for EUR/USD, targeting a rebound and an update of the new monthly high at 1.1844. A breakout and successful retest of that range would confirm a correct entry point and open the way toward the 1.1875 level. The ultimate target will be 1.1903, where I plan to take profit.
If EUR/USD declines and shows no activity around 1.1794, downward pressure on the pair will increase, potentially leading to a more significant drop. In that case, bears could push the price toward 1.1748. Only after a false breakout at that level will I consider buying the euro. Alternatively, I will open long positions on a rebound from 1.1686, targeting an intraday upward correction of 30–35 points.
To open short positions on EUR/USD:
Sellers have remained on the sidelines so far, especially as Eurozone data continues to be encouraging. If U.S. reports come in weak and Powell delivers dovish remarks, the euro may extend its rally. In that case, I plan to act only after a false breakout around 1.1844. This would serve as a reason to open short positions with a target at 1.1794.
A breakout and consolidation below this range would be a suitable sell signal, aiming for the 1.1748 level. The ultimate target will be 1.1686, where I intend to take profit. If EUR/USD moves upward again in the second half of the day and there is no strong bearish activity near 1.1844, buyers may continue to drive the bullish trend and update the 1.1875 level. I will consider selling only after a failed breakout there. Alternatively, I will open short positions on a rebound from 1.1903, targeting a downward correction of 30–35 points.
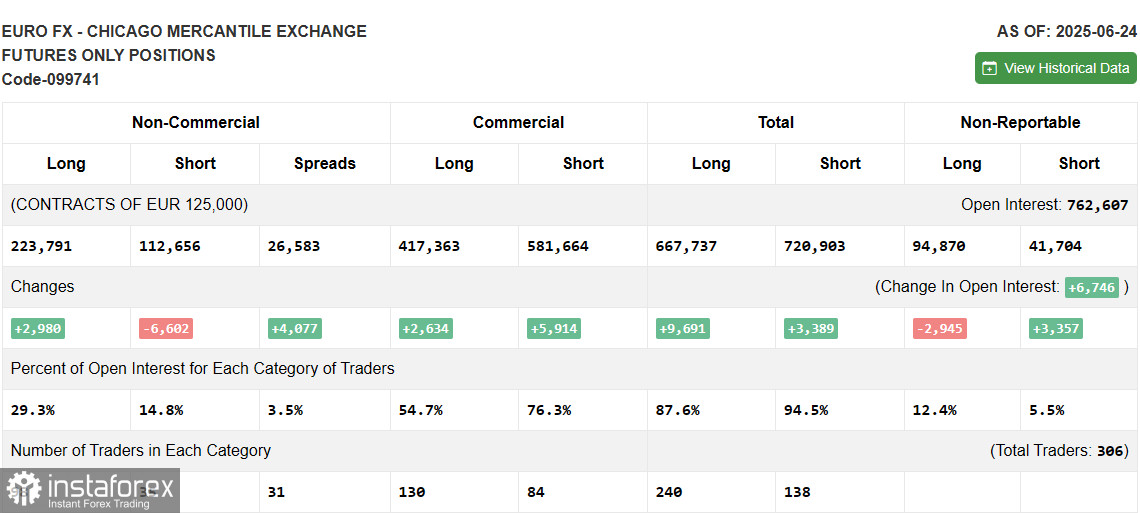
COT Report (Commitments of Traders) for June 24:
The report showed an increase in long positions and a decrease in short ones. Demand for the euro remains strong, while the U.S. dollar continues to weaken. Recent inflation and GDP data from the U.S. have led market participants to adjust their expectations toward earlier interest rate cuts by the Federal Reserve, putting significant pressure on the dollar. A series of key U.S. labor market reports is expected soon, which may further support the need for a more accommodative monetary policy.
The COT report indicated that non-commercial long positions increased by 2,980 to 223,791, while non-commercial short positions decreased by 6,602 to 119,258. As a result, the gap between long and short positions widened by 4,077.
Indicator Signals:
Moving Averages:Trading is occurring above the 30- and 50-period moving averages, indicating further upside for the euro.
Note: The periods and prices of the moving averages are considered by the author on the H1 (hourly) chart and differ from the classic daily moving averages on the D1 chart.
Bollinger Bands:If the pair declines, the lower band near 1.1765 will act as support.
Indicator Descriptions:
- Moving average – smooths out price volatility and noise to identify the current trend (50-period marked in yellow; 30-period marked in green).
- MACD (Moving Average Convergence/Divergence) – shows convergence/divergence of EMAs. Fast EMA – 12, Slow EMA – 26, Signal SMA – 9.
- Bollinger Bands – based on a 20-period moving average and standard deviation.
- Non-commercial traders – speculators such as individual traders, hedge funds, and large institutions who use the futures market for speculative purposes and meet specific criteria.
- Non-commercial long positions – total open long positions held by non-commercial traders.
- Non-commercial short positions – total open short positions held by non-commercial traders.
- Net non-commercial position – the difference between short and long positions held by non-commercial traders.


