


Trade Analysis and Recommendations for the Japanese Yen
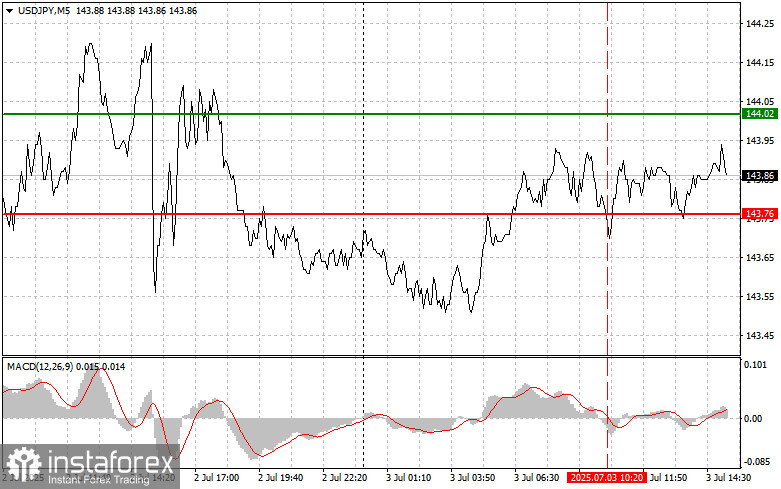
The test of the 143.76 level occurred when the MACD indicator had already moved significantly below the zero line, which limited the pair's downward potential. For this reason, I did not sell the dollar.
Data on nonfarm employment change, the unemployment rate, and average hourly earnings will determine the direction of the USD/JPY pair in the second half of the day. Investors and traders worldwide are holding their breath ahead of these crucial releases. Strong employment figures, especially if accompanied by wage growth, will support the case for continued tight monetary policy. This, in turn, would strengthen the U.S. dollar and make USD/JPY attractive for yield-seeking investors. On the other hand, disappointing data could raise doubts about the strength of U.S. economic growth, prompting the Federal Reserve to adopt a more dovish stance, which would weaken the dollar.
As for intraday strategy, I will primarily rely on executing Scenario #1 and Scenario #2.
Buy Signal
Scenario #1:Today, I plan to buy USD/JPY at the entry point around 143.98 (green line on the chart), targeting a rise to 144.39 (thicker green line). Around 144.39, I will exit long positions and consider selling in the opposite direction, anticipating a 30–35 point correction. A strong rise in the pair is likely only in the event of strong data.Important: Before buying, ensure that the MACD indicator is above the zero line and just beginning to rise.
Scenario #2:I also plan to buy USD/JPY in case of two consecutive tests of the 143.79 level when the MACD is in oversold territory. This would limit the pair's downward potential and trigger a market reversal to the upside. Expected targets are 143.98 and 144.39.
Sell Signal
Scenario #1:Today, I plan to sell USD/JPY after a break below the 143.79 level (red line on the chart), which could lead to a sharp drop. The primary target for sellers will be 143.29, where I will exit short positions and consider buying in the opposite direction, anticipating a 20–25 point rebound. Selling pressure will return in the case of weak data.Important: Before selling, make sure the MACD indicator is below the zero line and just starting to decline.
Scenario #2:I also plan to sell USD/JPY in case of two consecutive tests of the 143.98 level while the MACD is in overbought territory. This would limit the pair's upward potential and trigger a reversal to the downside. Expected targets are 143.79 and 143.29.
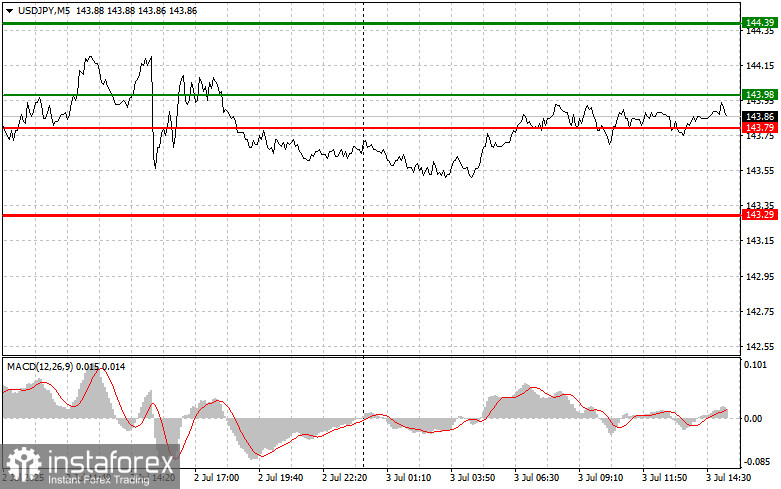
Chart Key:
- Thin green line – suggested entry level for buying the instrument;
- Thick green line – projected Take Profit level or a point where profit can be manually secured, as further growth above this level is unlikely;
- Thin red line – suggested entry level for selling the instrument;
- Thick red line – projected Take Profit level or a point where profit can be manually secured, as further decline below this level is unlikely;
- MACD indicator – use overbought and oversold zones to guide market entries.
Important Note for Beginner Forex Traders:Be extremely cautious when entering the market. It is best to stay out of the market ahead of key fundamental releases to avoid sharp price swings. If you decide to trade during news events, always use stop-loss orders to minimize potential losses. Without stop-losses, you could quickly lose your entire deposit—especially if you neglect money management and trade large volumes.
And remember, successful trading requires a well-defined trading plan like the one outlined above. Spontaneous trading decisions based on short-term market conditions are typically a losing strategy for intraday traders.


