


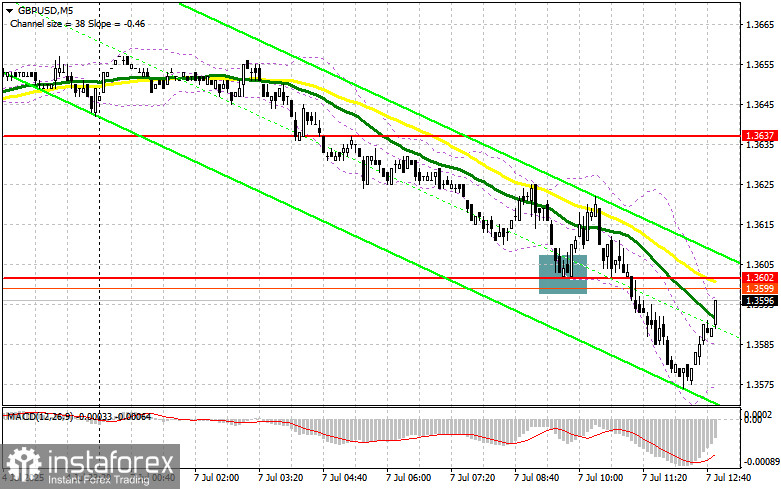
In my morning forecast, I highlighted the 1.3602 level and planned to use it to determine entry points into the market. Let's look at the 5-minute chart and analyze what happened. A decline and a false breakout around 1.3602 provided a good entry point for buying the pound, resulting in a 20-point rise in the pair. The technical outlook was revised for the second half of the day.
To open long positions on GBP/USD:
As expected, the UK Halifax house price index data was ignored by the market, and the pound continued its downward trend from the morning. However, as it approached a significant support area around 1.3570, the pressure on the pair eased. Unfortunately, there are no U.S. statistics or Federal Reserve speakers in the second half of the day, so all attention will be on Trump and his trade tariffs.
If the pound falls again, I plan to buy only around the major support at 1.3565. A false breakout there would provide a good entry point for long positions with the target of returning to the resistance at 1.3602, where I expect strong opposition. A breakout with a retest from top to bottom of this range would provide a new entry point for long positions with the prospect of a move to 1.3637. The ultimate target will be the 1.3677 level, where I will take profit.
If GBP/USD falls and there is no bullish activity around 1.3565 in the second half of the day, pressure on the pound could intensify significantly. In that case, only a false breakout near 1.3532 would be a suitable condition to open long positions. I plan to buy GBP/USD immediately on a rebound from the 1.3489 support level, aiming for a 30–35 point intraday correction.
To open short positions on GBP/USD:
Sellers remained resilient and pushed the pound even lower during European trading. Now, the key task is to defend the 1.3602 resistance, which earlier acted as support. A false breakout there will serve as an entry point for selling, targeting a drop to the 1.3565 support level. A breakout and retest from bottom to top of that range would trigger stop-loss orders and open the path to 1.3532. The ultimate target will be the 1.3489 level, where I will take profit.
If demand for the pound returns in the second half of the day and bears fail to show activity around 1.3602, a larger rally in GBP/USD cannot be ruled out. In that case, it would be better to delay selling until a test of the 1.3637 resistance, where the moving averages—currently favoring sellers—are located. I will open short positions there only on a false breakout. If there is no downward movement at that level either, I will look for short entries on a rebound around 1.3677, but only targeting a 30–35 point intraday correction.
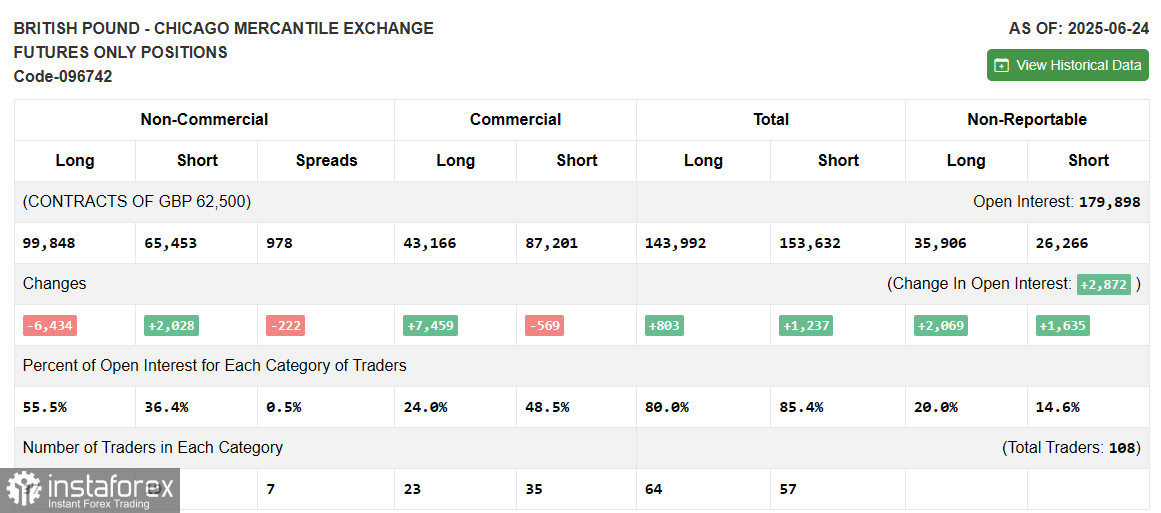
The COT (Commitment of Traders) report for June 24 showed an increase in short positions and a reduction in longs. The British pound continues to show a solid upward trend, and the latest UK GDP and inflation data support its continuation. The possibility that the U.S. Federal Reserve may cut interest rates earlier than planned is already putting pressure on the U.S. dollar. A series of upcoming U.S. labor market reports will determine the future direction of the GBP/USD pair.
According to the latest COT report, long non-commercial positions declined by 6,434 to 99,848, while short non-commercial positions increased by 2,028 to 65,453. As a result, the gap between long and short positions narrowed by 222.
Indicator Signals:
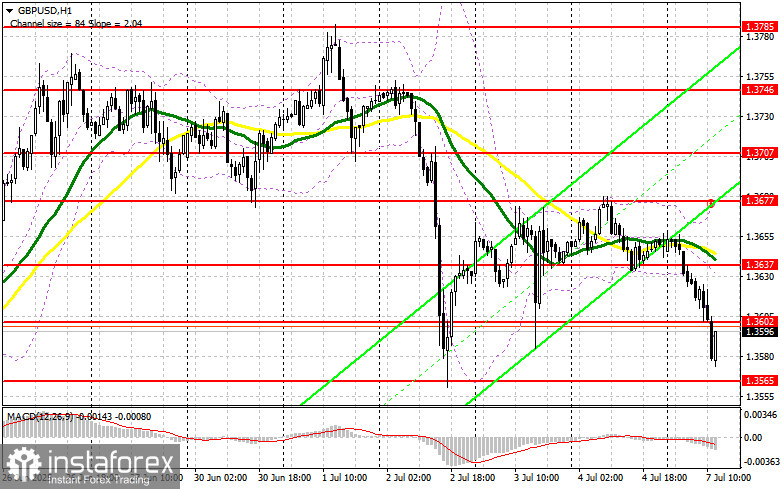
Moving AveragesTrading is occurring below the 30- and 50-period moving averages, which suggests potential further downside for the pair.
Note: The periods and prices of the moving averages referenced by the author are based on the H1 (hourly) chart and may differ from the classic daily moving averages on the D1 chart.
Bollinger BandsIn the event of a decline, the lower boundary of the indicator around 1.3605 will act as support.
Indicator Descriptions:
- Moving Average – identifies the current trend by smoothing volatility and noise. Period: 50 (marked in yellow on the chart).
- Moving Average – identifies the current trend by smoothing volatility and noise. Period: 30 (marked in green on the chart).
- MACD (Moving Average Convergence/Divergence) – Fast EMA: period 12, Slow EMA: period 26, Signal line (SMA): period 9.
- Bollinger Bands – Period: 20.
- Non-commercial traders – speculators such as individual traders, hedge funds, and large institutions using the futures market for speculative purposes and meeting specific criteria.
- Long non-commercial positions – the total long open interest of non-commercial traders.
- Short non-commercial positions – the total short open interest of non-commercial traders.
- Net non-commercial position – the difference between short and long positions held by non-commercial traders.


