


The four-hour (H4) chart for Bitcoin (#Bitcoin) reveals a bearish price performance, characterized by a sustained decline and intensifying selling pressure. Currently trading at 79,714.30, the price has clearly broken through several previous support levels and critical pivot points, signaling that the bears (sellers) are in complete control of short-term market activity.
Technical Analysis and Price Action
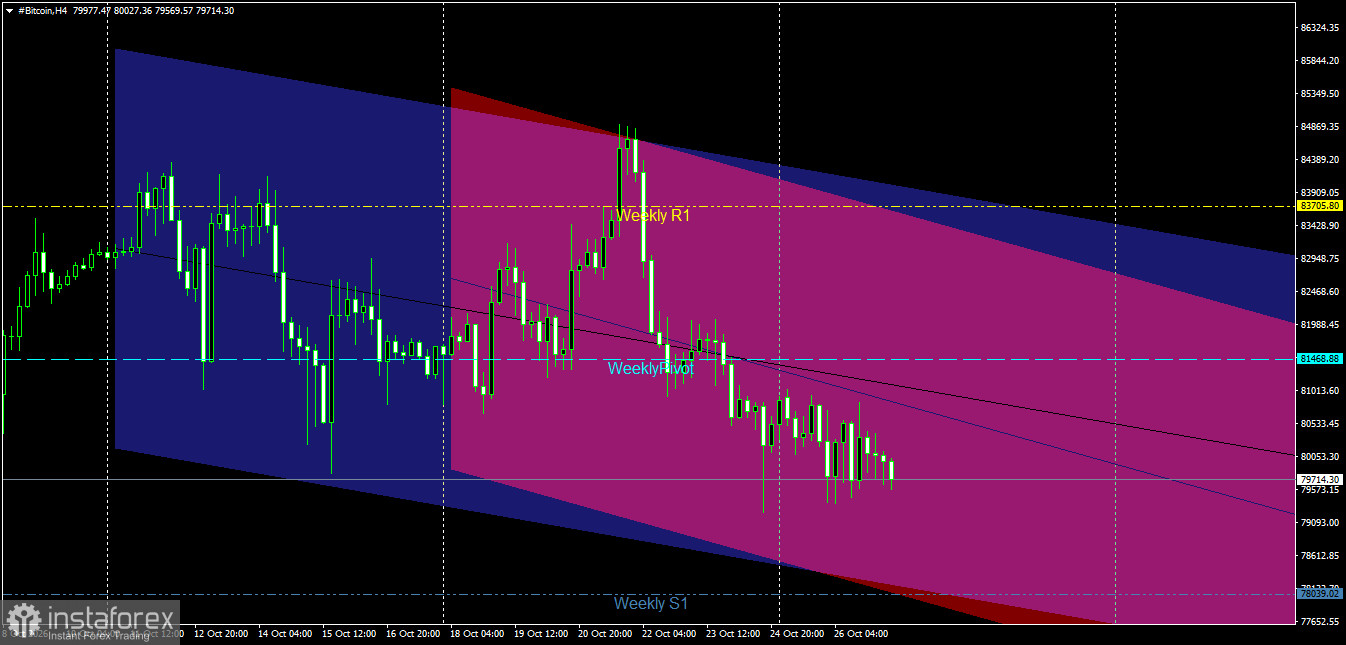
Price Channel Structure: The price is moving within a broad, primary descending channel (in blue), which reflects the overall downward trend. Overlaid on this is a steeper, secondary descending channel (in pink/red) that is exerting strong downward pressure, driving the price to reach successive lows. Notably, the price is currently positioned near the lower boundaries of these channels, with weak attempts by buyers to establish intraday support levels proving largely unsuccessful.
Interaction with Weekly Pivot Levels: The price faced early downward pressure, leading to a breach of the weekly pivot point at 81,468.88. This level, once a significant support, has now shifted into a resistance barrier that hinders any potential recovery. This decline follows repeated failures to break through the first weekly resistance level (Weekly R1) at 83,705.80; consequently, the price is now steadily moving toward the first weekly support level (Weekly S1) at 78,039.02. Pivotal Support and Resistance Levels
Key Resistance Levels:
First Resistance: 81468.88 (Weekly Pivot point and immediate resistance barrier).
Second Resistance: 83705.80 (Weekly R1 resistance level).
Pivotal Resistance: 85000.00 and above (upper boundary of the descending channels).
Key Support Levels:
First Support: 79000.00 (psychological barrier and current intraday focal point).
Second Support: 78039.02 (Weekly S1 support level).
Pivotal Support: 77000.00 and below, should the collapse and sell-off wave continue.
Price Action Outlook and Trading Recommendations
Bearish Scenario (Primary):
The negative trend remains dominant and most likely as long as trading stays below the Weekly Pivot point of 81468.88.
Recommendation: It is advisable to sell into any corrective upward rebounds toward the 80500.00 – 81468.88 range, provided these levels continue to cap any price advances.
Technical Targets: Aim for a break below the 79000.00 barrier, targeting a move toward the first weekly support level at 78039.02.
Corrective Bullish Scenario (Alternative):
This scenario would be triggered if sudden buying pressure emerges from current levels, successfully lifting the price and breaking above the Weekly Pivot point. Confirmation condition: A 4-hour candle must close clearly above the 81,468.88 level.
Technical targets: This would pave the way for a deeper bullish correction, targeting the 82,800.00 level, followed by an approach toward the first resistance level at 83,705.80.
Risk Management
Trading in cryptocurrency markets during periods of intense downward momentum requires strict adherence to capital management rules. Risk per trade should be capped at a maximum of 2%, and stop-loss orders must be precisely placed to protect the portfolio against sharp, sudden price reversals.
Bitcoin Price Status on the Daily Chart:
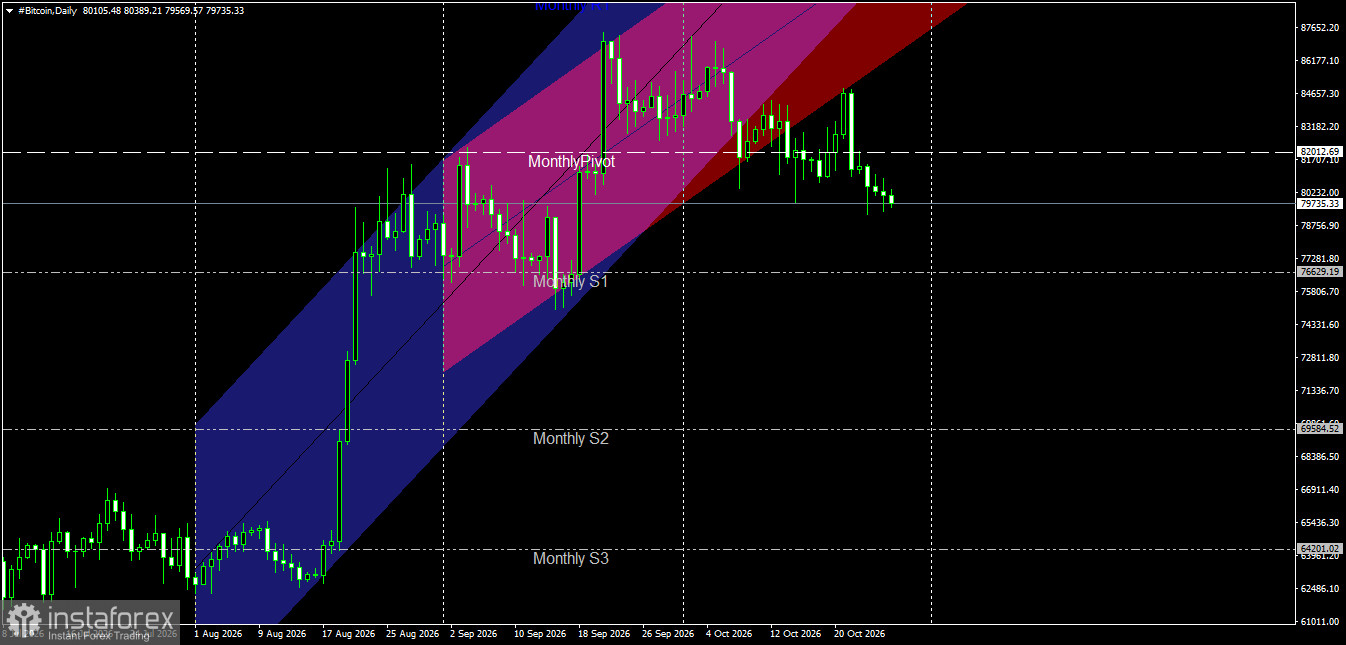
The price is currently trading at 79,735.33, outside the ascending channels on the daily timeframe. It is experiencing a sustained decline, reflecting persistent, intense selling pressure as it remains below key pivot levels—specifically the monthly pivot point at 82,012.69.
Analysis of the Last Two Candles (Yesterday's and Today's):
Yesterday's Candle: A "Doji" candle, which does not indicate significant liquidity but keeps the price trading below the monthly pivot level.
Today's Candle: Shows continued negative momentum, with the price attempting to consolidate below the psychological barrier of 80,000.00, accompanied by downward pressure aimed at testing lower levels.
Outlook for Future Movement:
Bearish Scenario (Primary): This remains the most likely outcome as long as the price stays below the monthly pivot point and nearby resistance levels. The decline could potentially continue, targeting the next monthly support level at 76,629.19 (Monthly S1).
Bullish Scenario (Alternative): This would require the emergence of significant buying pressure, leading to a reversal and a successful stabilization above the immediate technical resistance levels, allowing for a return to a positive trend.


