


Trend Analysis (Figure 1)
On Thursday, the market may continue its downward movement from the 1.1639 level (yesterday's daily close), targeting 1.1560 – the 61.8% retracement level (red dashed line). Upon testing this level, the price may rebound upward toward 1.1588 – the 76.4% retracement level (red dashed line). Once this level is reached, a continued downward move is expected.
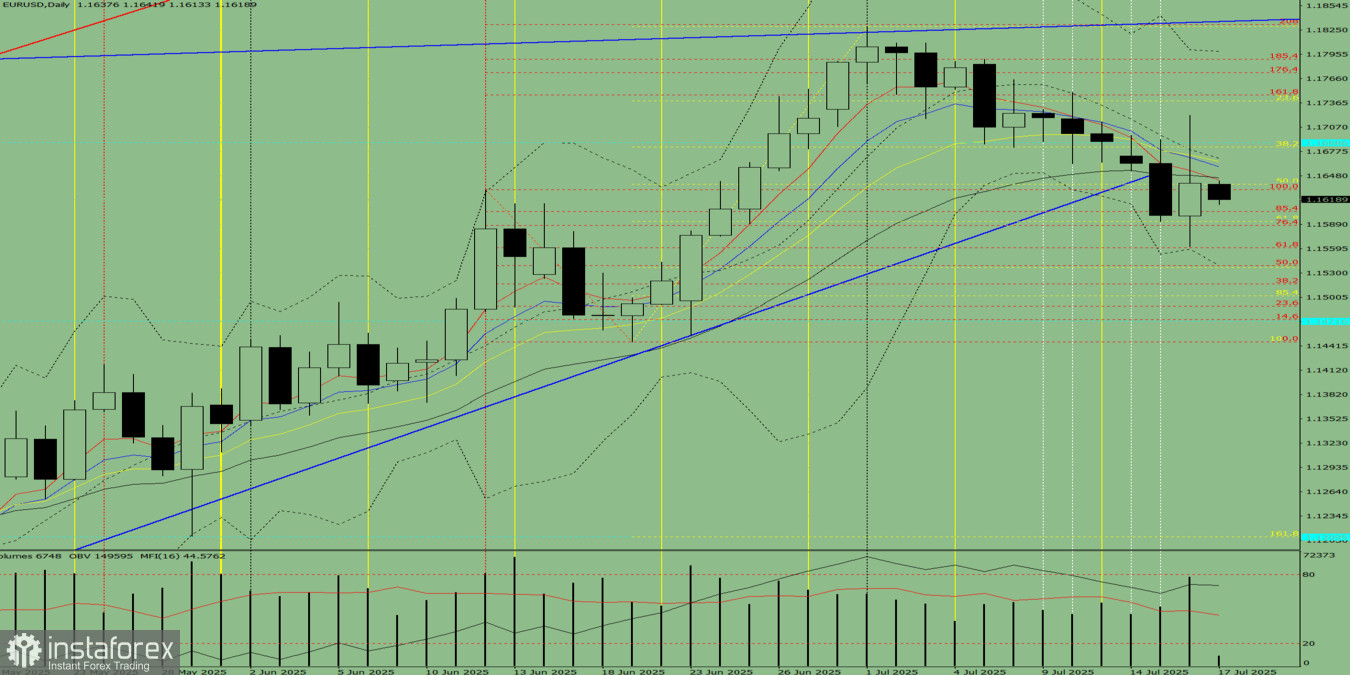
Figure 1 (daily chart)
Comprehensive Analysis:
- Indicator analysis – downward
- Fibonacci levels – downward
- Volume – downward
- Candlestick analysis – downward
- Trend analysis – downward
- Bollinger Bands – downward
- Weekly chart – downward
Overall conclusion: a bearish trend.
Alternative scenario: On Thursday, the market may continue downward from the 1.1639 level (yesterday's daily close), targeting 1.1539 – the 50% retracement level (red dashed line). Upon testing this level, the price may rebound upward toward 1.1560 – the 61.8% retracement level (red dashed line).


