


Trend Analysis (Figure 1)
On Thursday, the market may continue its downward move from the 1.3417 level (yesterday's daily close), targeting 1.3369 – the lower fractal (yellow dashed line). From this level, the price may rebound upward toward 1.3405 – the historical resistance level (light blue dashed line).
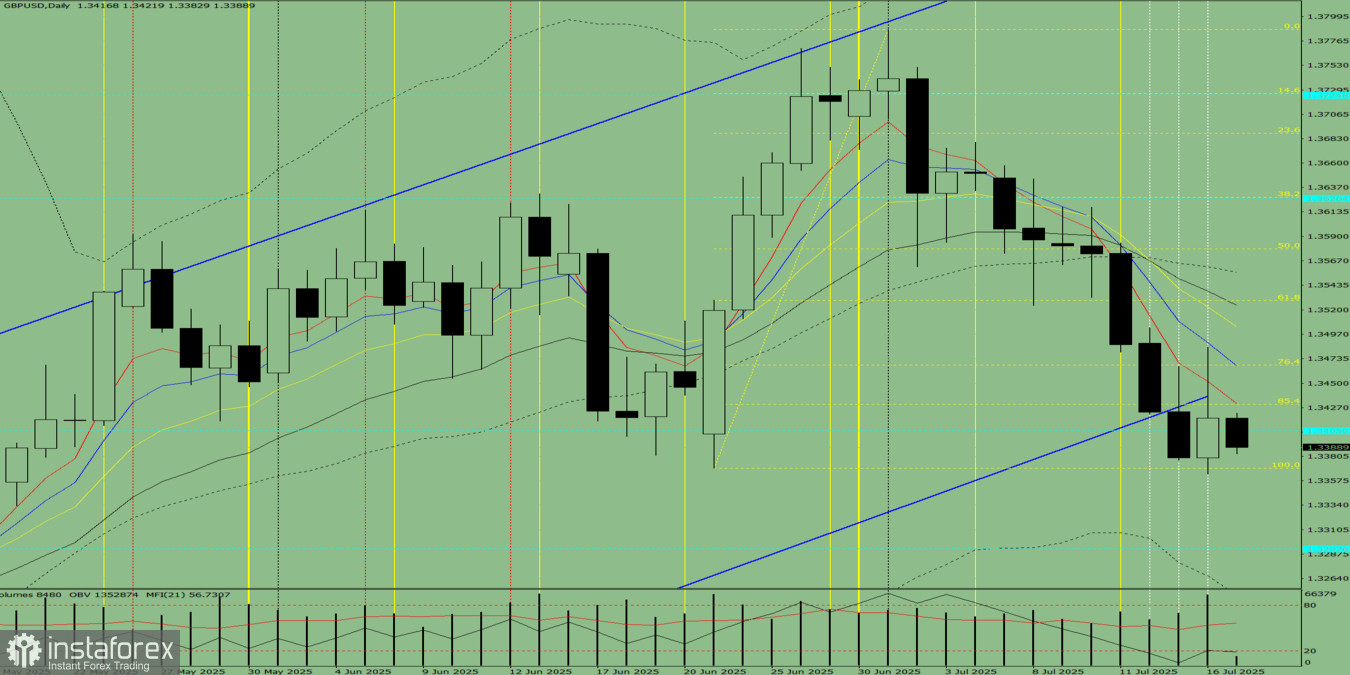
Figure 1 (daily chart)
Comprehensive Analysis:
- Indicator analysis – downward
- Fibonacci levels – downward
- Volume – downward
- Candlestick analysis – downward
- Trend analysis – downward
- Bollinger Bands – downward
- Weekly chart – downward
Overall conclusion: a bearish trend.
Alternative scenario: From the 1.3417 level (yesterday's daily close), the price may continue downward toward 1.3369 – the lower fractal (yellow dashed line). From this level, it may then continue further down toward 1.3293 – the historical resistance level (light blue dashed line).


