


Trend Analysis (Fig. 1):
On Friday, the market may continue moving upward from the 1.3412 level (yesterday's daily close), targeting 1.3464 – the 23.6% retracement level (red dashed line). Upon testing this level, a downward movement may follow with a target of 1.3430 – the 85.4% retracement level (yellow dashed line).
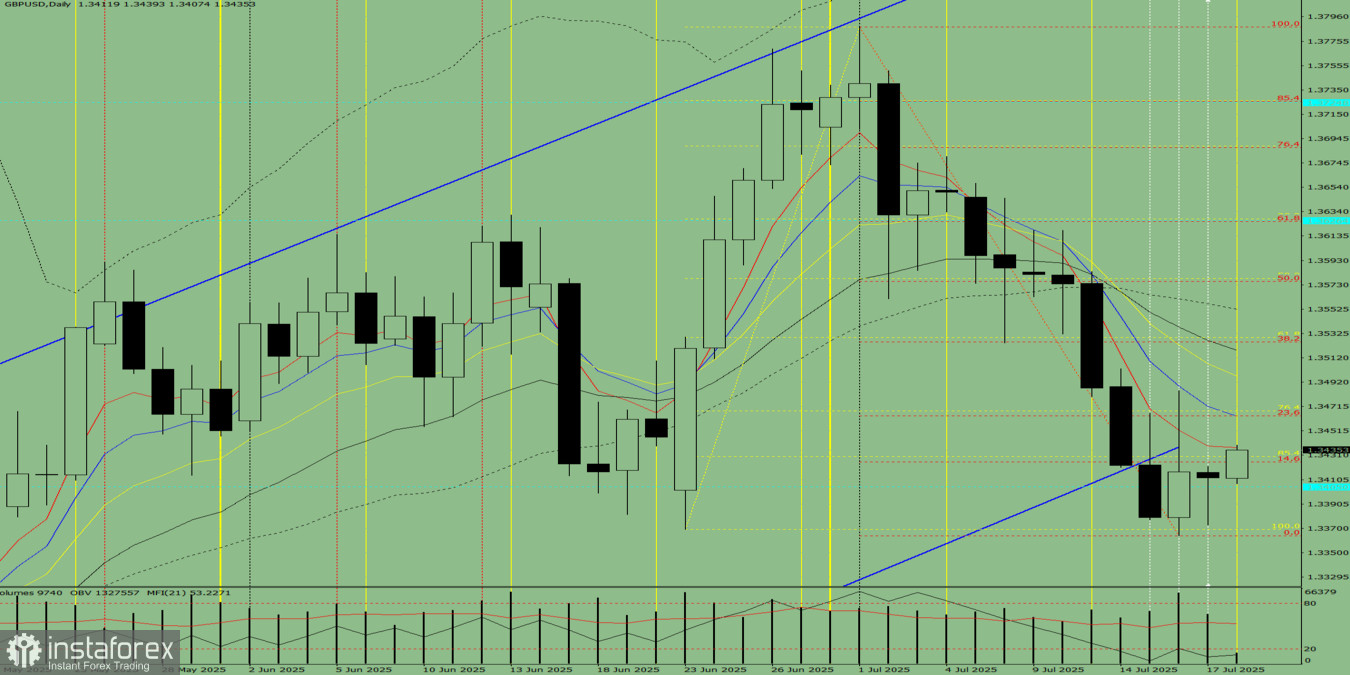
Fig. 1 (Daily Chart)
Comprehensive Analysis:
- Indicator analysis – upward
- Fibonacci levels – upward
- Volume – upward
- Candlestick analysis – upward
- Trend analysis – upward
- Bollinger Bands – upward
- Weekly chart – upward
Overall conclusion: bullish trend.
Alternative scenario:The price may start moving upward from the 1.3412 level (yesterday's daily close), targeting 1.3463 – the 8-period EMA (thin red line). Upon testing this line, a downward movement toward 1.3405 – historical support level (blue dashed line), is possible.


