


Trend Analysis (Fig. 1)
On Tuesday, the market may begin to move downward from the 1.3489 level (closing of the previous daily candle), targeting the 23.6% pullback level at 1.3465 (red dashed line). Upon testing this level, the price may resume upward movement toward the 38.2% pullback level at 1.3525 (red dashed line).
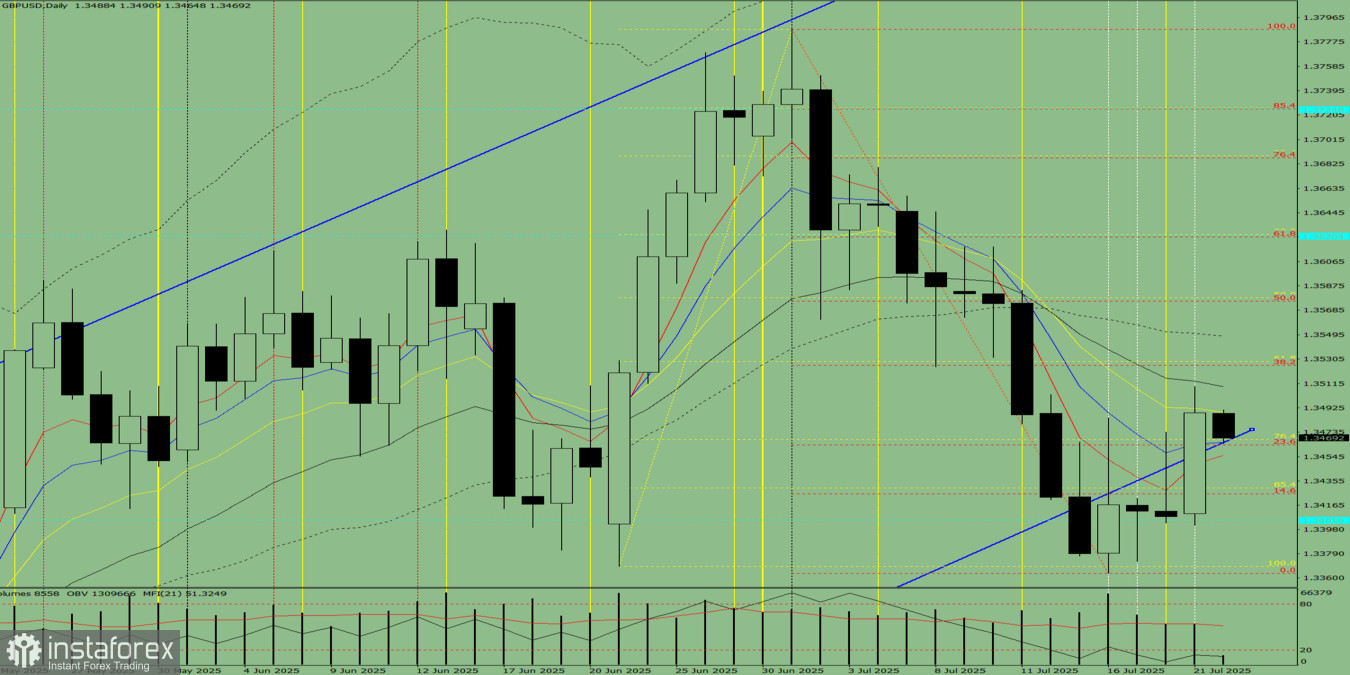
Fig. 1 (Daily Chart)
Composite Analysis:
- Indicator analysis – upward
- Volume analysis – upward
- Candlestick analysis – upward
- Trend analysis – upward
- Bollinger Bands – upward
- Weekly chart – upward
General Conclusion: Upward trend
Alternative Scenario:
From the 1.3489 level (closing of the previous daily candle), the price may begin to move downward toward the 8-period EMA at 1.3456 (thin red line). Upon testing this line, the price may start rising toward the 61.8% pullback level at 1.3529 (yellow dashed line).


