


A divergence has formed on the monthly chart of the S&P 500. The entire growth of the index from March 2020 to July 2025 fits neatly into the Fibonacci grid, meaning that the levels of this grid serve as reference points for the correction.
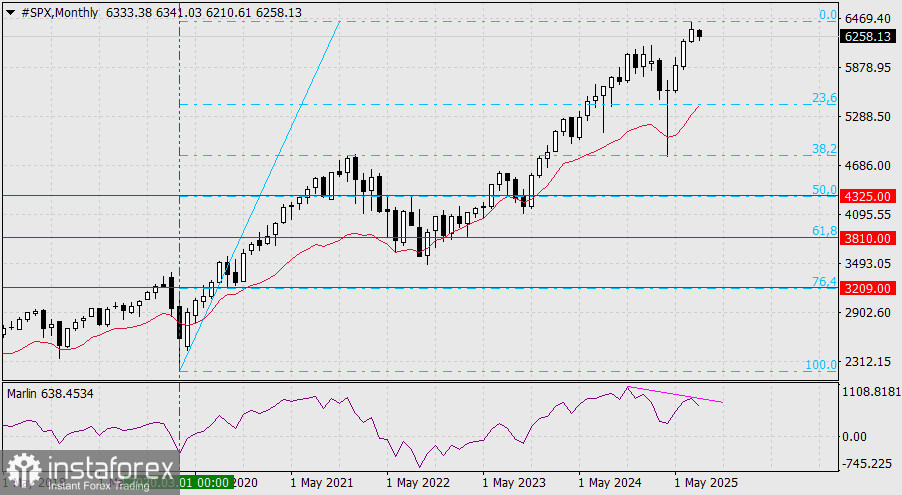
We believe the market decline will be no less than 50%, as the 4802 level (the 38.2% retracement) has already been tested retrospectively by an earlier correction in April. The potential completion of a large-scale correction could occur at the following levels:
- 4325 (50.0%) – the August 2022 high,
- 3810 (61.8%) – the March 2023 low,
- 3209 (76.4%) – the September 2020 low.
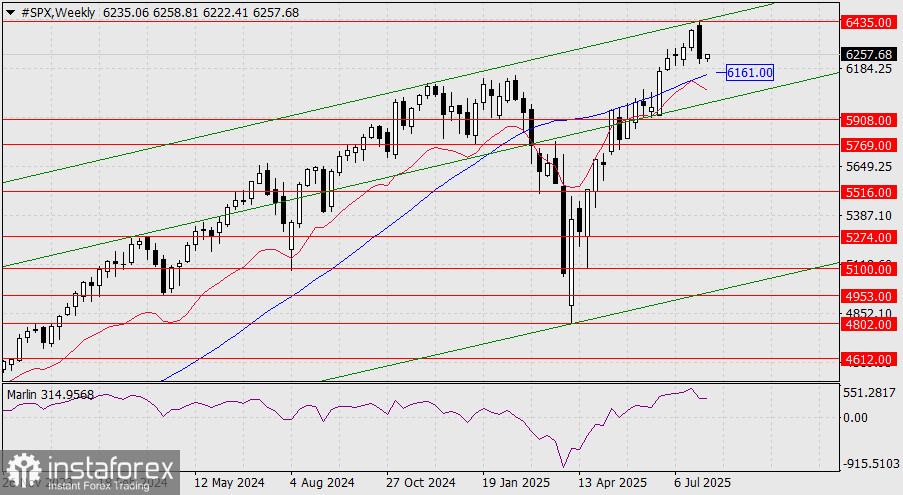
On the weekly chart, the price reversed from the upper boundary of the price channel. Below, there is still the MACD line, which must be broken through to confirm the reversal. There may be a struggle around this line at 6161. The Marlin oscillator is declining, but as long as it remains in positive territory, it cannot fully support the price decline.
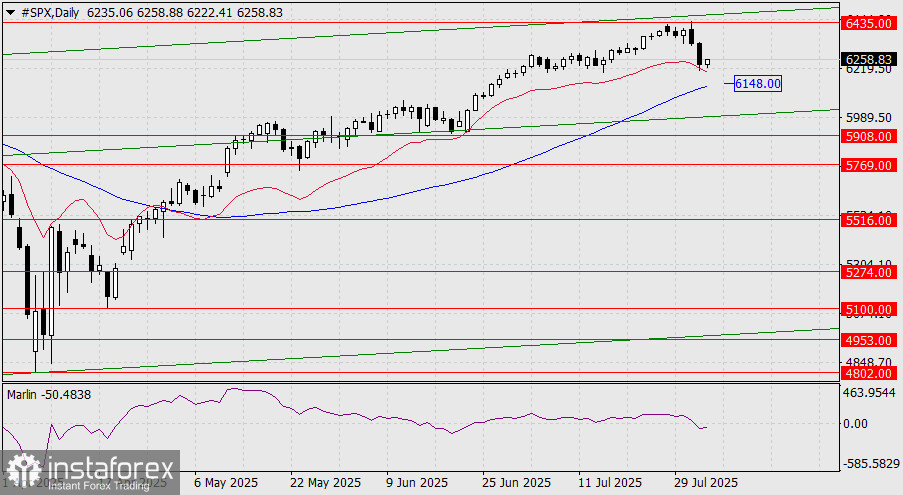
On the daily chart, the MACD line is also close to the current price, at 6148. However, here the Marlin oscillator is already in the downtrend territory, suggesting that attacks on indicator-based support levels may recur.


