


A divergence has formed on the weekly chart of the EUR/GBP pair. It is likely that the correction from the decline between September 2022 and December 2024 has come to an end.
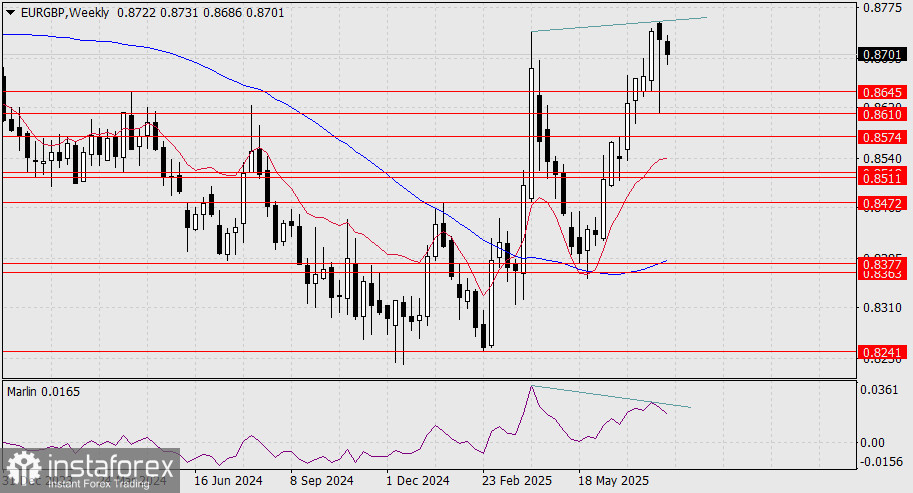
This may indicate that in the medium term, the price will fall below the target level of 0.8241.
On the daily chart, the price is still naturally located above the balance and MACD indicator lines, but within a few days, these lines will converge, leading to a "moment of truth," which in the main scenario suggests a victory for the bears.
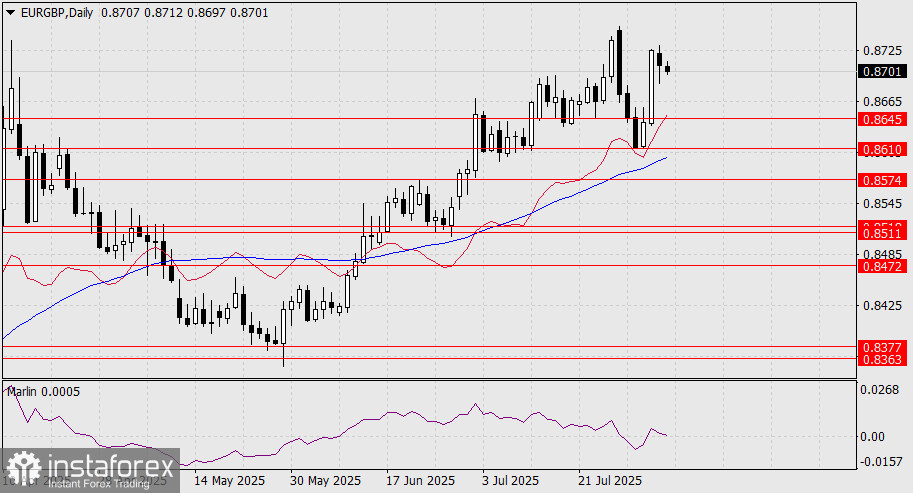
The Marlin oscillator may already enter negative territory today, preparing the price in advance for a confrontation with the MACD line and the target levels at 0.8645 and 0.8610.
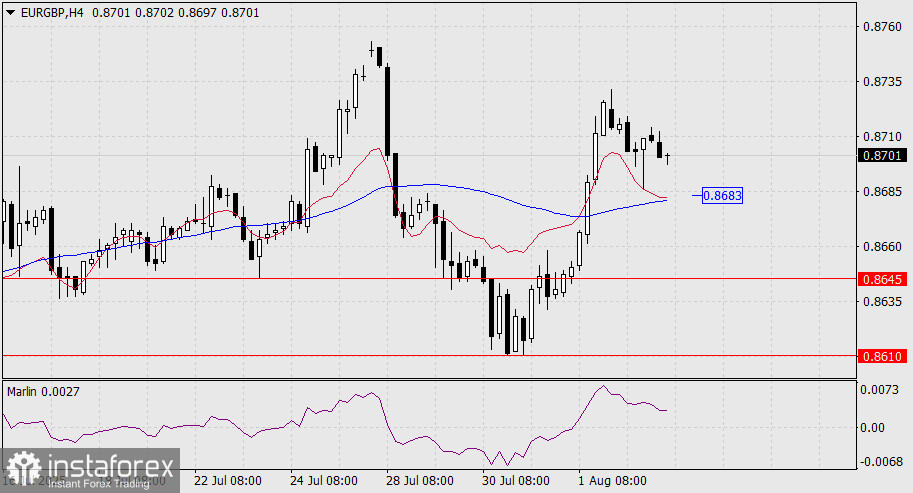
On the four-hour chart, the price is also moving above the indicator lines, and here the key level is the MACD line at 0.8683. A consolidation below this level would open the path to the target at 0.8645.


